

Creating a Dashboard
In the admin: Dashboards › New Dashboard
New Dashboard, at the top of the Dashboards list, offers two ways to start:
- Blank: an empty draft. You add its widgets and variables yourself.
- From a table: pick a table or view, and TotalBase proposes the widgets, variables and filters. You choose what goes in.
The same two choices show as large buttons when no dashboard is selected. A table's or view's page in Database also has Create Dashboard, which opens From a table with that table already chosen.
Either way, the result is an unpublished draft that only administrators see.
create_dashboard, tries each query with preview_query, saves the widgets with save_widget and publishes with publish_dashboard. See Recipes › A dashboard.Blank
New Dashboard › Blank asks for its identity only:
| Field | |
|---|---|
| Name | Required, up to 32 characters, unique. Its name in the admin and in the App menu |
| Description | Optional, up to 128 characters |
| Slug | Its address in the App: /admin/app/dashboards/operations. Proposed from the name until you edit it |
| Icon, Color | Optional, for the menu entry |
| Show in the App menu | On by default. Turn it off for a dashboard that only makes sense embedded in a DataView page |
Create opens the new dashboard in the editor.
From a table
New Dashboard › From a table is a four-step assistant. It reads the table's definition, its constraints and PostgreSQL's statistics, never its rows, and proposes a dashboard you then review.
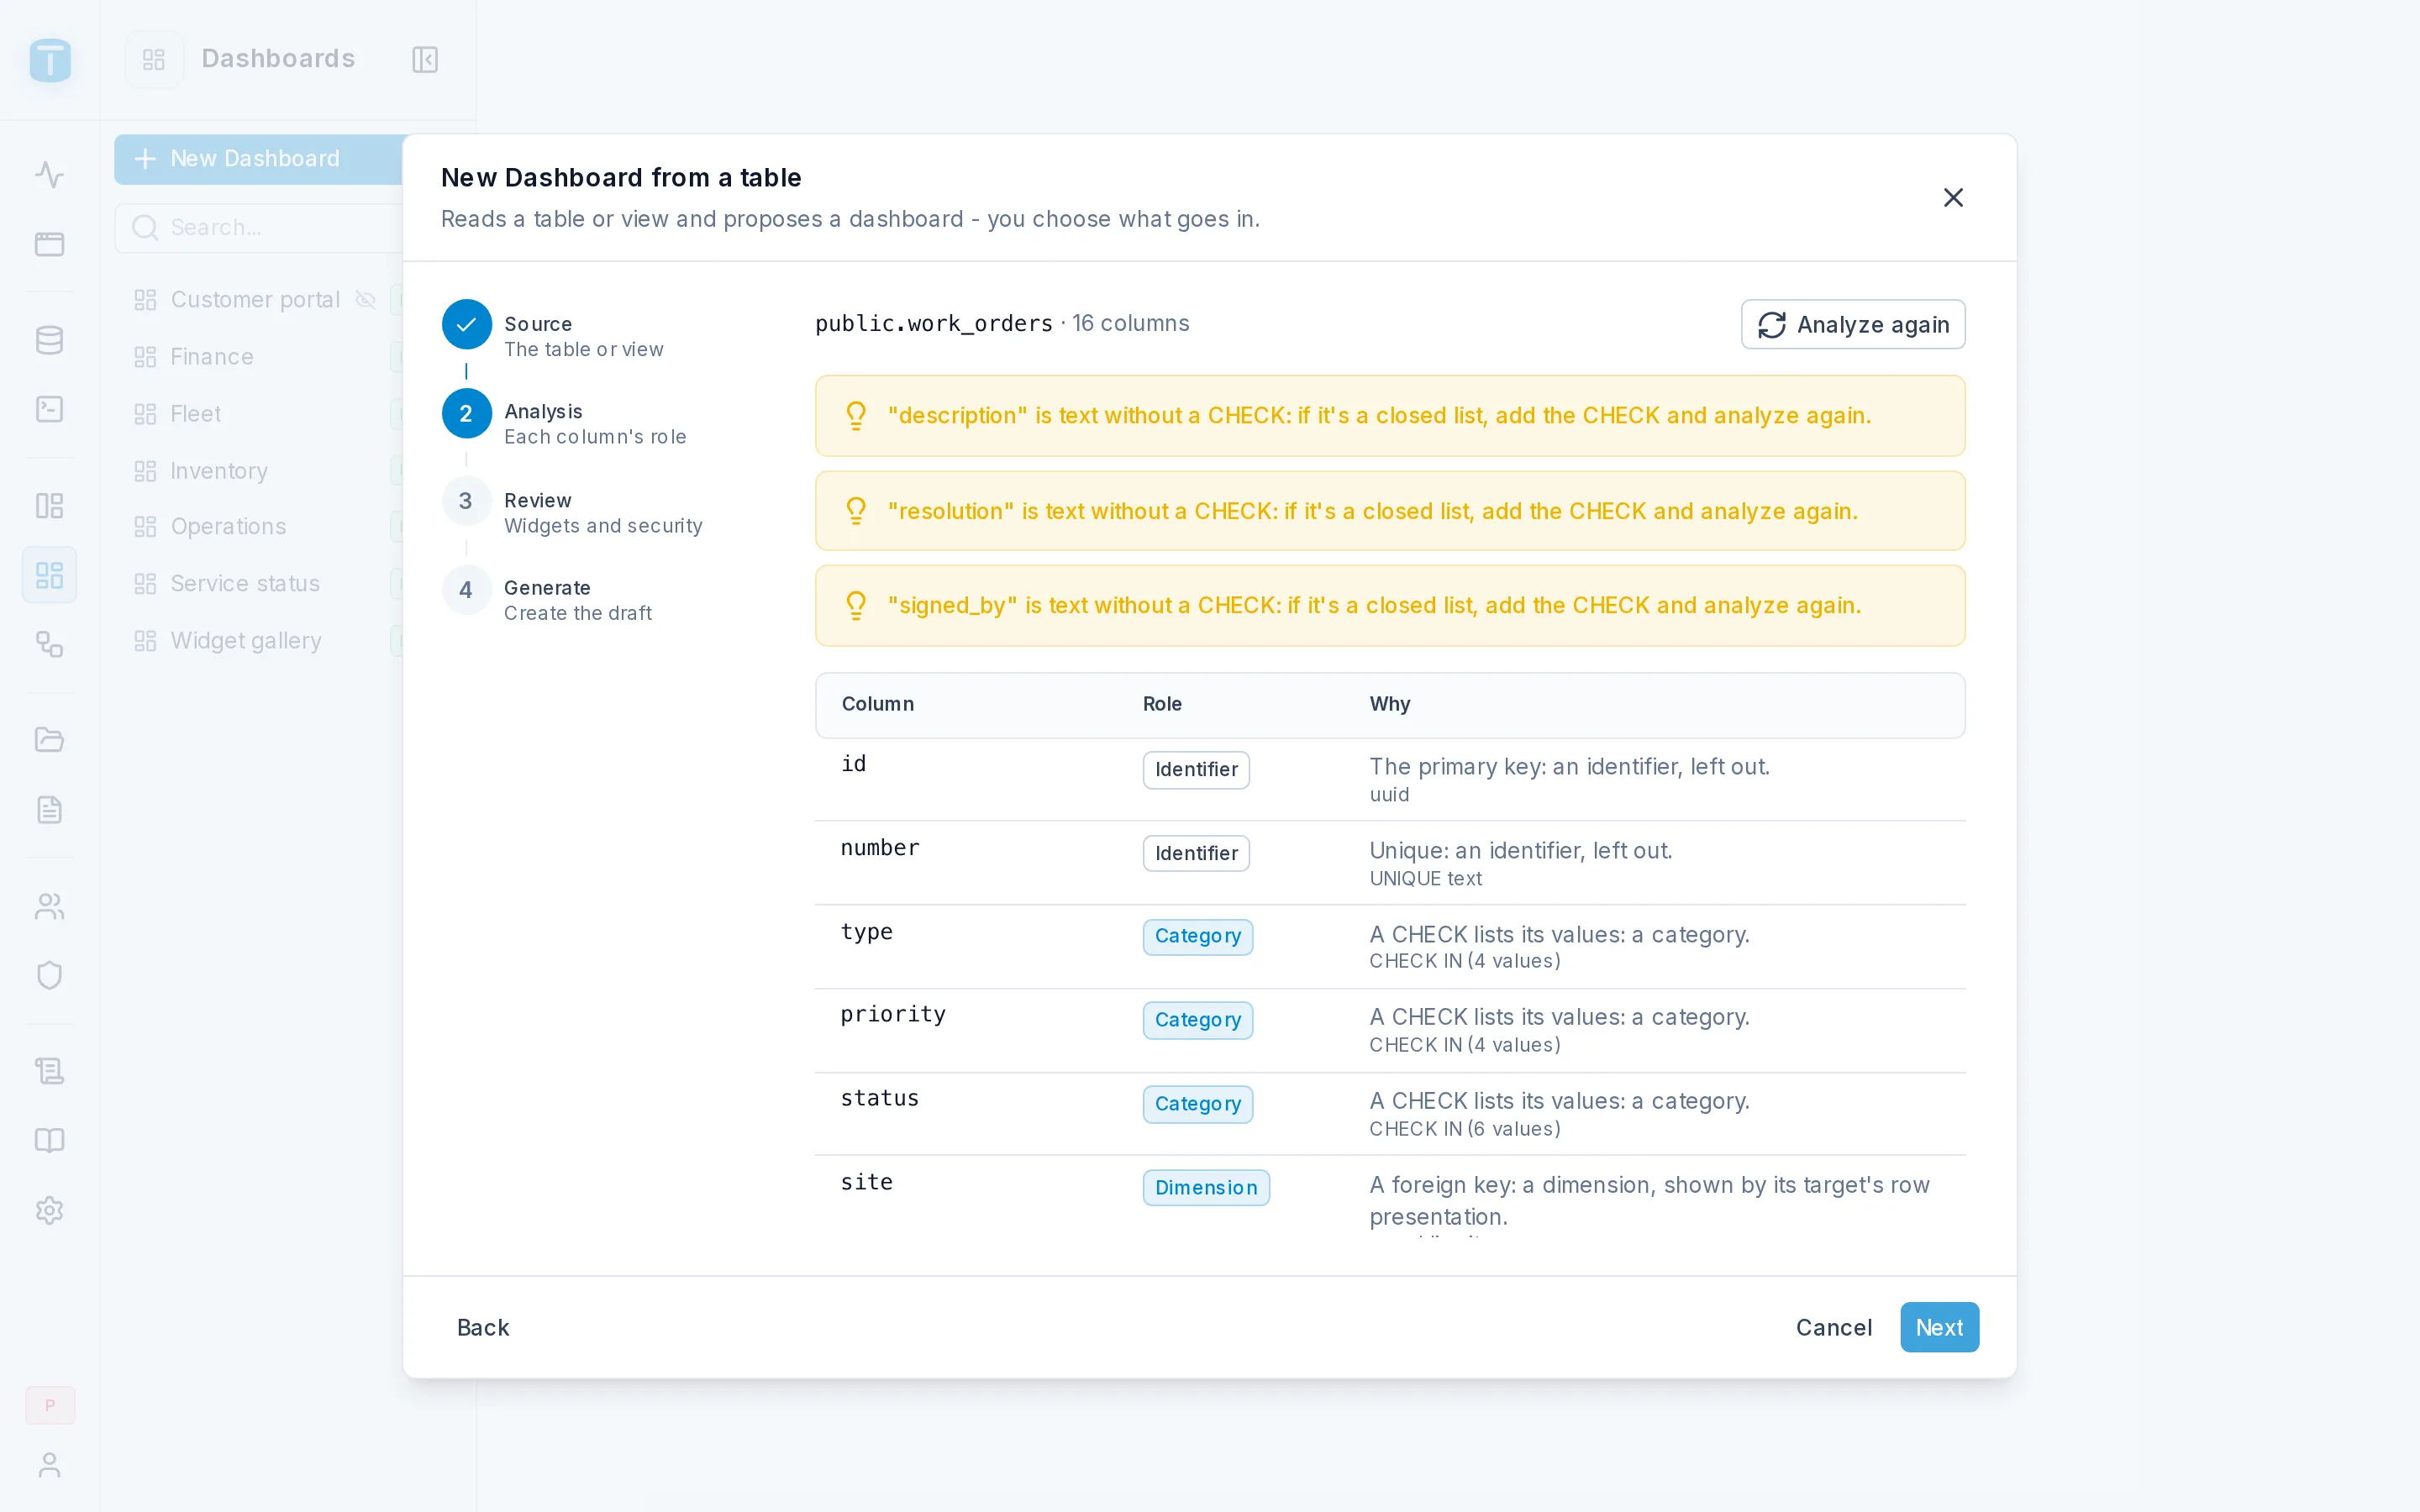
1. Source
Pick the Table or view. Choosing it analyzes it at once: 12 columns analyzed, 9 widgets proposed.
2. Analysis
Each column with the Role it was given and Why:
| Role | A column that is | Becomes |
|---|---|---|
| Moment | a required date or timestamp with a default of now() or CURRENT_DATE, such as reported_at | the time axis and the period filter |
| Deadline | a date that defaults to the future, such as due_at | never an axis |
| Measure | a number that isn't a key | a sum or an average |
| Category | a CHECK list, an enum, a boolean, a small range of whole numbers, such as status or priority | a donut, a split |
| Dimension | a foreign key, shown by its table's row presentation, such as branch or technician | a ranking and a filter |
| Place | a point, such as a site's location | a map |
| File | a foreign key to the files table | a thumbnail |
| Identifier | the primary key, a unique column, free text with many values | left out |
| Discarded | a single value, a uuid without a foreign key, text without a CHECK | left out |
Above the table, hints say what would make the proposal better, such as adding a CHECK to a text column so it can be charted. After you change the table, Analyze again reads it again and keeps what you ticked.
3. Review
- Name: up to 32 characters; the slug comes from it.
- Widgets: a checkbox per widget, each with its type and why it was proposed. The proposed ones are ticked: KPIs, a ranking per dimension, the trend over the moment, a donut per small category, a map of the place, the latest records. More are listed unticked.
- Variables: the filters viewers will pick: a date range over the moment, and a list for each dimension with few enough rows. You change them later in Settings › Variables.
- Security: a notice that the queries run with the dashboard's authority, so every viewer sees every row. When your users table has a foreign key to a dimension's table, such as Acme's
branch, two options appear, off by default:
| Option | Does |
|---|---|
| Open on the viewer's branch | the branch list starts on the viewer's own branch; they can change it |
| Only the viewer's branch | every query adds ($USER.branch IS NULL OR branch = $USER.branch): a viewer sees only their branch's rows; one without a branch, such as a manager, sees all of them. The branch list and ranking are left out |
At most one is on. Choosing one switches to its proposal and keeps your ticks.
4. Generate
A summary: name, source, number of widgets and variables, and the security chosen. Create Dashboard creates the draft and opens it. If the server finds a problem, it lists each one with the widget it's in, and nothing is created.
What it creates is an ordinary draft. Every widget's SQL stays visible and editable, and there is no link back to the assistant.
Next steps
- Editor: add and arrange widgets.
- Editing a Widget: write a widget's query.