

Tables
In the admin: a Dashboard › a widget › Edit
Table widgets show the rows themselves: as a grid, as one record's fields, or aggregated into a pivot.
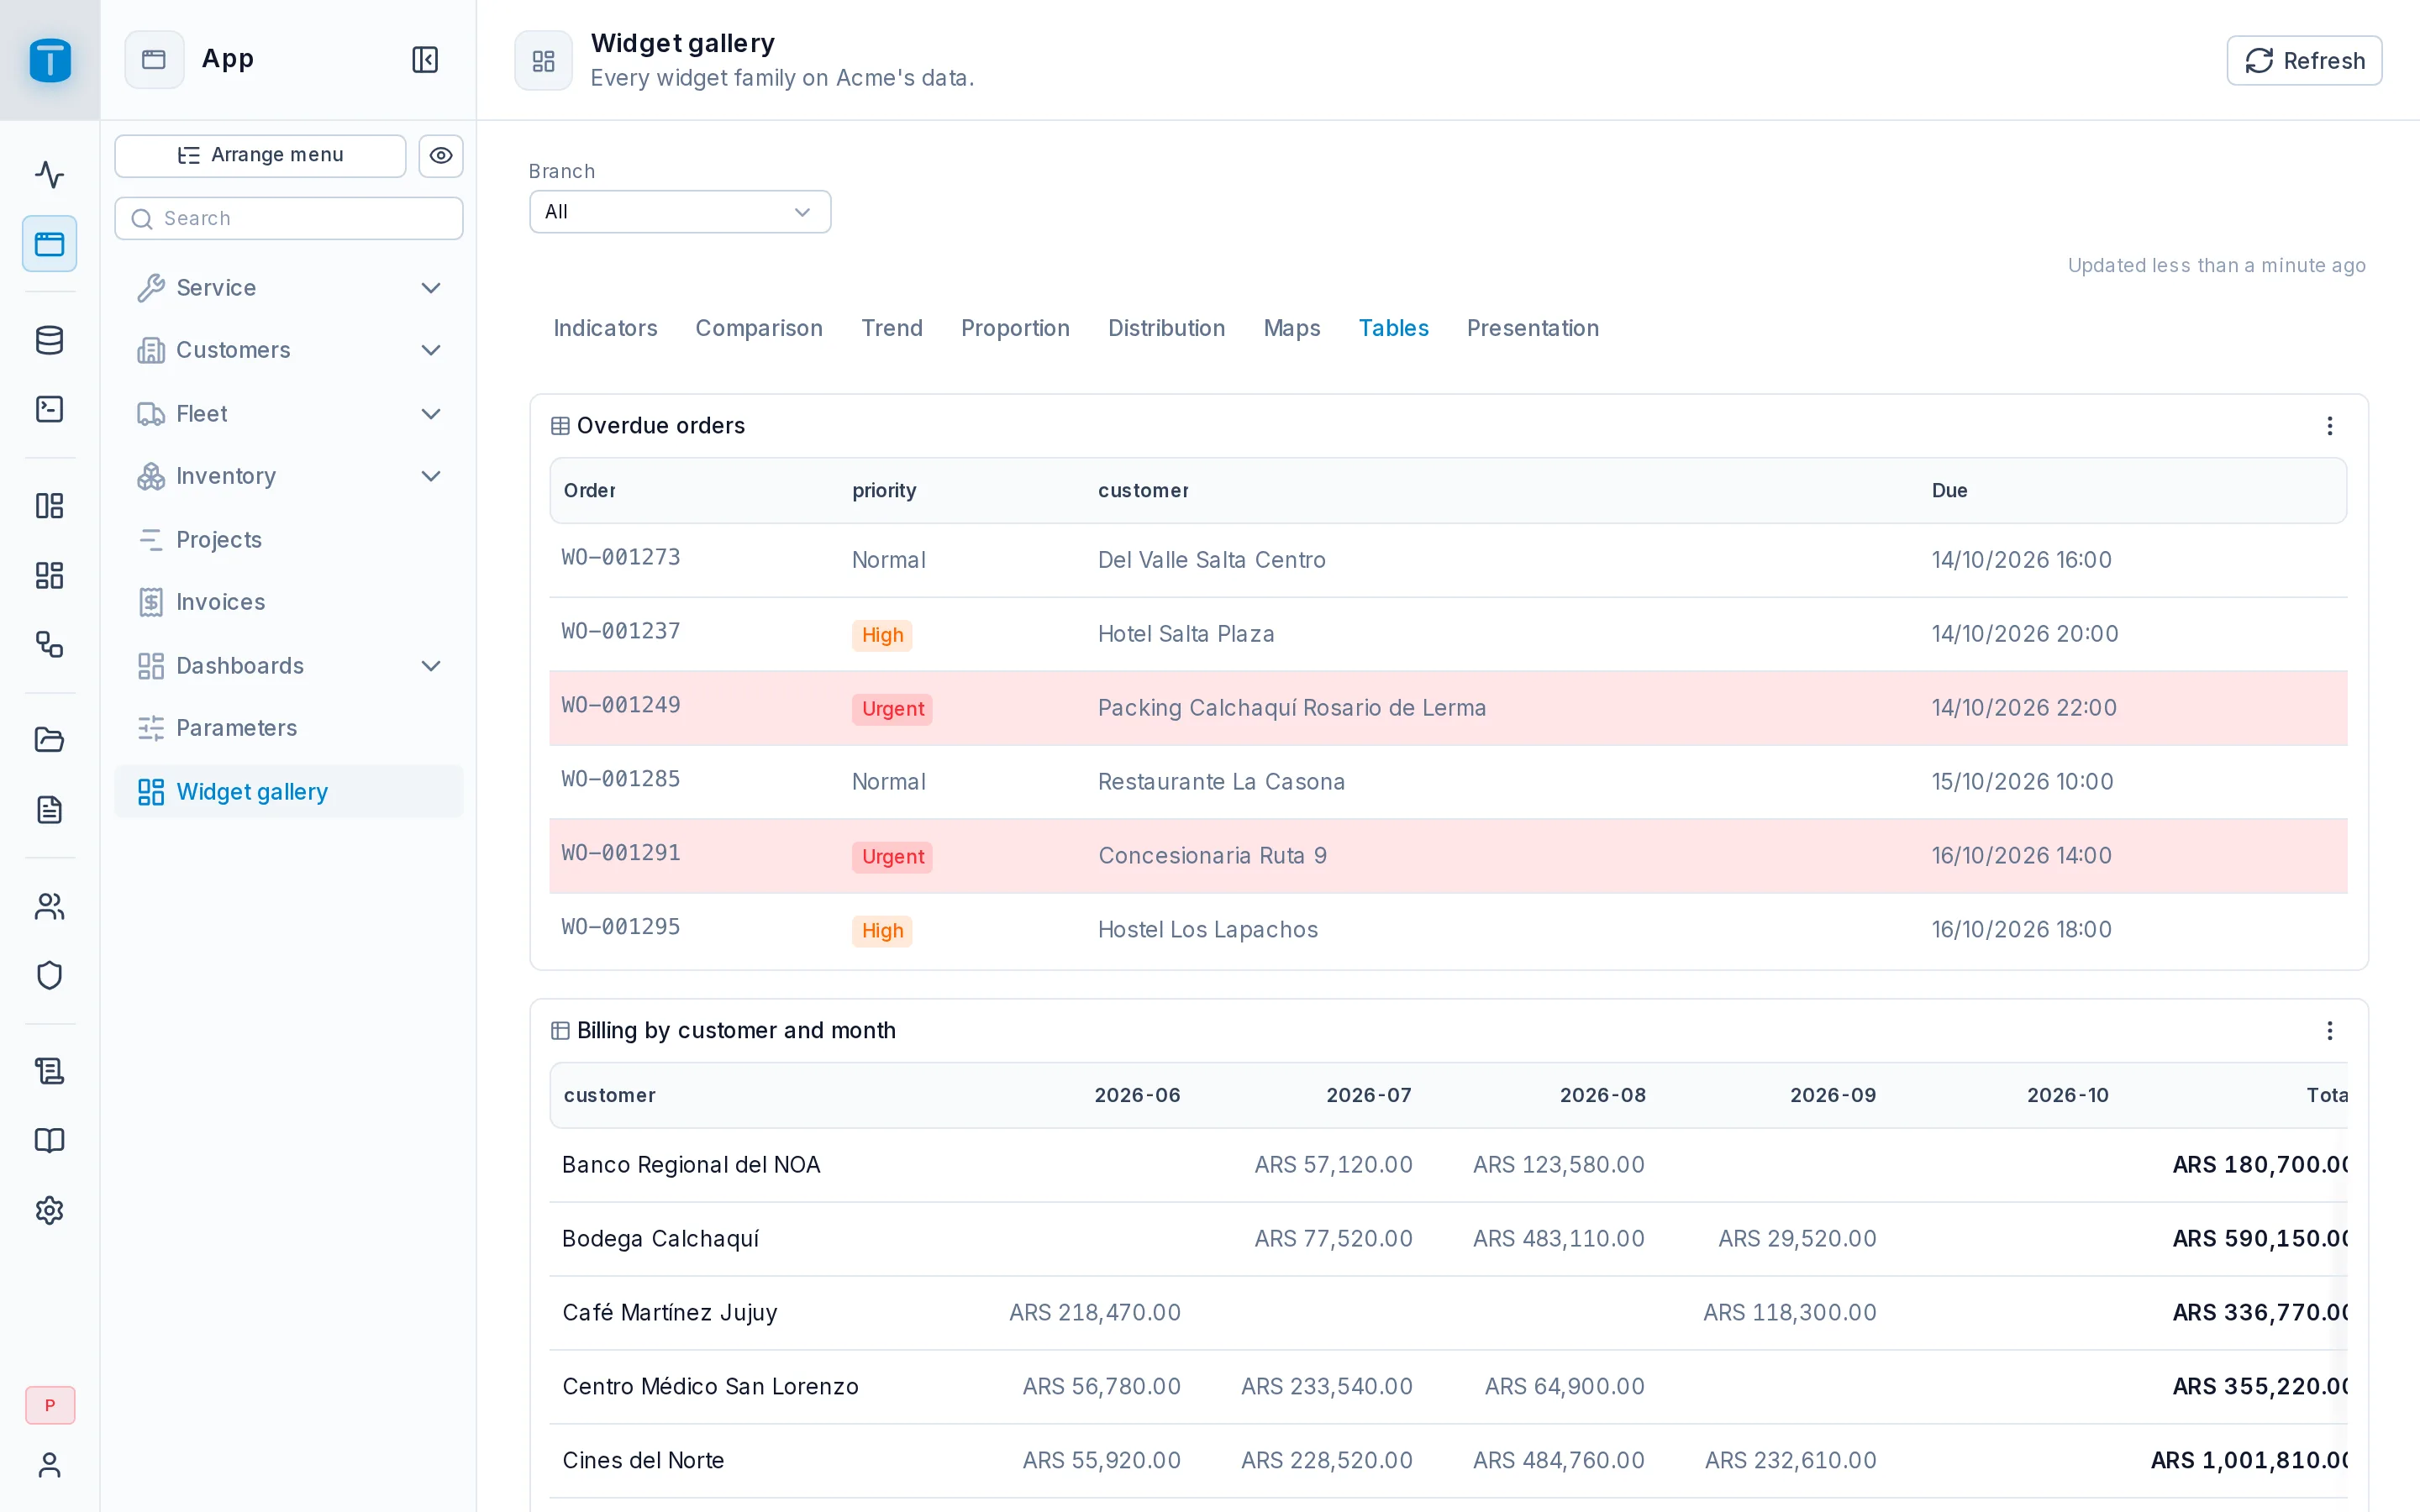
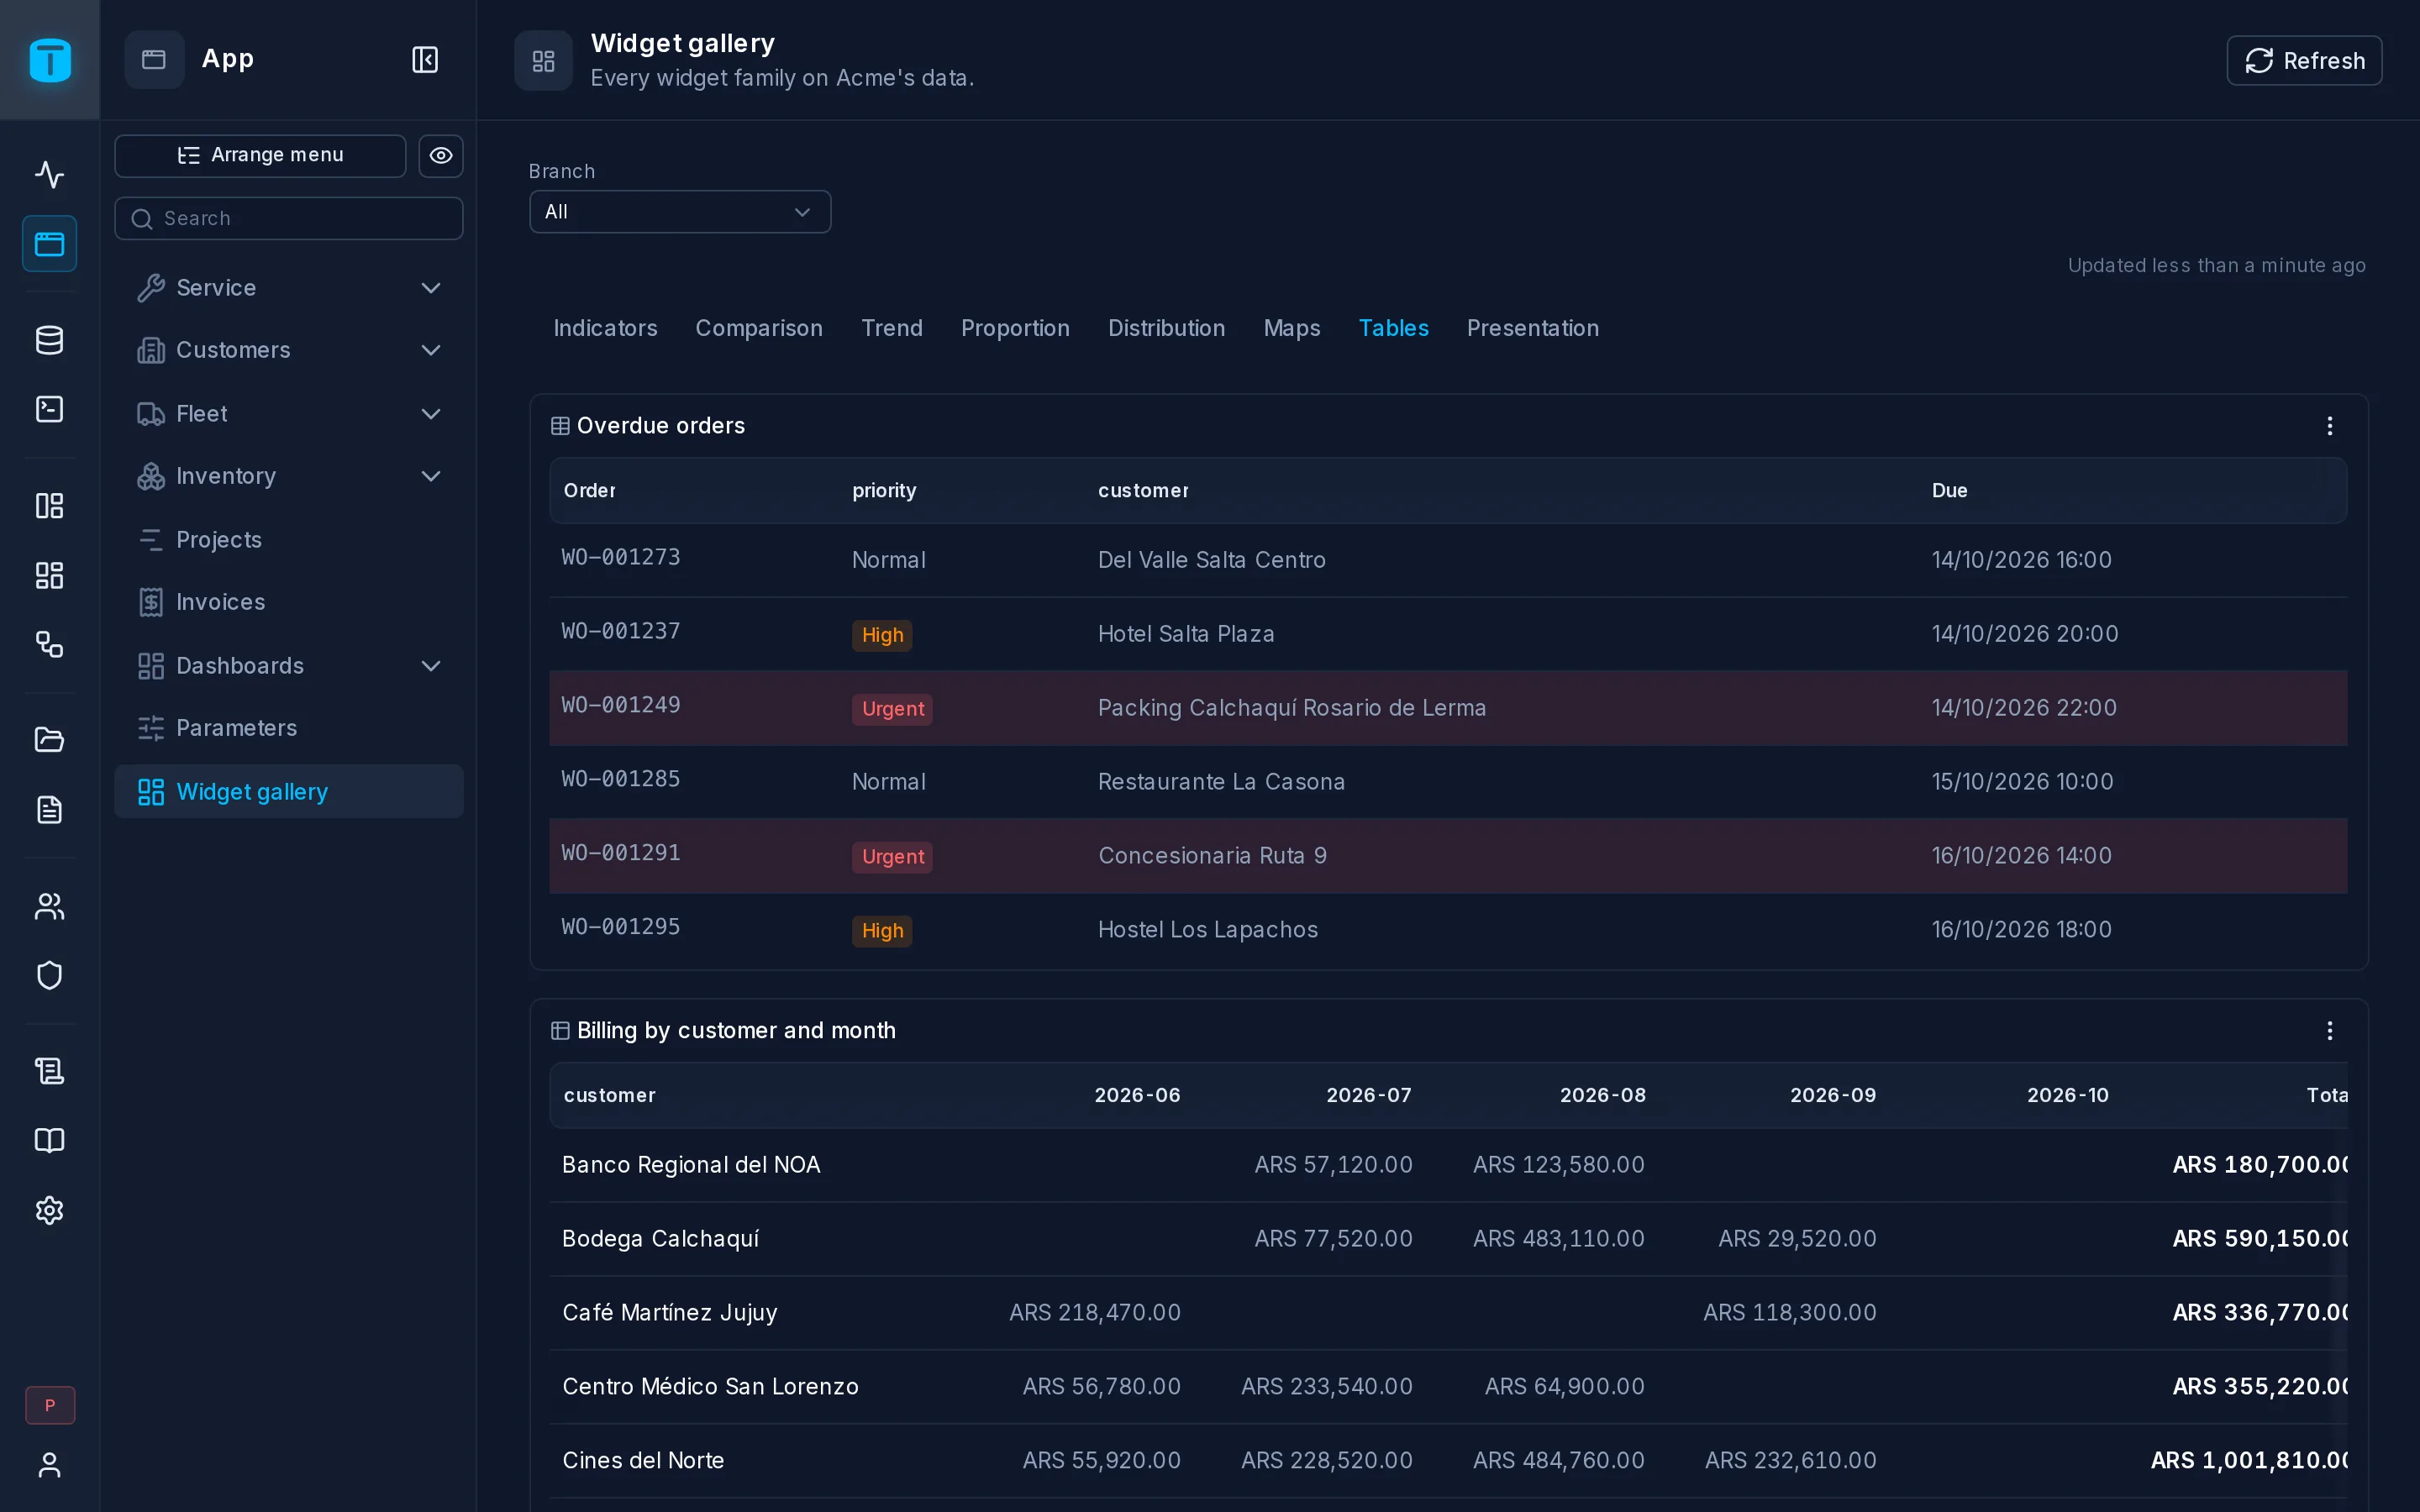
Table
The rows as they come, in the query's order.
| Role | Takes | Unset |
|---|---|---|
| Columns | the columns shown, in order | every column, except those starting with _ |
Acme's overdue orders, the priority as a colored badge and the order's id kept for a click:
SELECT wo.number, c.name AS customer, s.name AS site,
       wo.priority, wo.due_at,
       CASE wo.priority WHEN 'URGENT' THEN 'red' WHEN 'HIGH' THEN 'orange' END AS _priority_color,
       wo.id AS _id
FROM work_orders wo
JOIN sites s ON s.id = wo.site
JOIN customers c ON c.id = s.customer
WHERE wo.status NOT IN ('COMPLETED', 'CANCELLED')
  AND wo.due_at < now()
ORDER BY wo.due_at
LIMIT 50
- Titles and formats come from each column's presentation in Database:
priorityreads Urgent,due_atin the viewer's date format. A computed column is titled by its alias. - Types: numbers right-aligned in the viewer's format, booleans centered, dates and times in the viewer's zone, a file as its thumbnail.
- Sorting: a click on a header sorts the rows already loaded: ascending, descending, back to the query's order.
- Colors:
_colortints a row;_priority_colorshowspriorityas badges. See SQL Conventions.
| Setting | |
|---|---|
| Column settings | per column: its title and short title, alignment, format, text when empty, labels for true and false, link, look (bold, italic, monospace, color, background), hidden, and its Total |
| Color column | a column whose palette name tints its row; unset, _color. It's never shown |
| On click | what a click on a row does: Open a record with {{row._id}} opens the order's form |
Totals
A column's Total, Sum, Average, Minimum, Maximum or Count, adds a footer row. PostgreSQL computes it over every row the query returns, in the same read-only transaction, not over the rows shown, so it stays right when the result is cut at the row cap. It reads in the column's format.
TABLE
The rows as they come - columns starting with _ never show.
Size: 12 × 5 of the 12-column grid, at least 4 × 3 · Also: events, export
| Data | Code | Takes | Required | Unset | |
|---|---|---|---|---|---|
| Columns | columns | category, number, time, point, file | yes | all | The columns shown, in this order. Defaults to every column (but _ ones). |
| Property | Code | Section | Values | |
|---|---|---|---|---|
| Column settings | columnSettings | format | Per column, by name: {label, shortLabel, displayFormat, emptyText, booleanLabels, linkType, options, align, fontSize, bold, italic, mono, underline, strike, color, background, hidden, total} - over what its presentation says. total: sum, avg, min, max or count - a footer row computed by PostgreSQL over every row the query returns (not only those shown), in the column's format. | |
| Color column | colorColumn | appearance | A column whose value - a palette name - tints its row. Unset, a column named _color. _ | |
| On click | click | events | What a click on a mark does: {action: "FILTER", variable, value} sets a variable of this dashboard; {action: "DATAVIEW", dataview, filter} opens a DataView filtered (the where grammar); {action: "DASHBOARD", dashboard, variables, tab}; {action: "RECORD", dataview, pk}; {action: "URL", url, newTab, inEmbeds}. Values are formulas over (_ columns too) and ; targets by id. hint: the tooltip's last line. On a table, a click on a row. |
SELECT * FROM (VALUES (1001, 'Ana', 250.5, 'PAID', 'emerald'), (1002, 'Luis', 99.9, 'PENDING', 'amber'), (1003, 'Marta', 410, 'CANCELLED', 'red')) AS t(order_no, customer, total, status, _status_color)
Detail
One row as label / value pairs, with its image: the query's first row. The drawer says when the query returns more than one.
| Role | Takes | Unset |
|---|---|---|
| Columns | the fields shown, in order | every column, except those starting with _ |
| Image | a file column, shown as its image above, or beside with two columns | the first file column |
A vehicle chosen in a Select variable:
SELECT v.plate, v.make, v.model, v.year, v.status, v.odometer_km,
       v.insurance_until, v.inspection_until, v.photo
FROM vehicles v
WHERE v.id = $VAR.vehicle::uuid
| Setting | |
|---|---|
| Layout | Automatic (two columns from 6 grid columns wide, one on a phone), One column, Two columns |
| Field settings | per field: its title, format, text when empty, look |
| On click | what a click on the card does |
DETAIL
One row as label / value pairs, with its image - the query's first row.
Size: 4 × 4 of the 12-column grid, at least 3 × 2 · Also: events, export
| Data | Code | Takes | Required | Unset | |
|---|---|---|---|---|---|
| Columns | columns | category, number, time, point, file | yes | all | The fields shown, in this order. Defaults to every column (but _ ones). |
| Image | image | file | first | A file column shown as its image, above (or beside, with layout TWO). Defaults to the first file column. |
| Property | Code | Section | Values | |
|---|---|---|---|---|
| Layout | layout | appearance | AUTO, ONE, TWO; default AUTO | AUTO: two columns from 6 wide, one on a phone; ONE; TWO. |
| Field settings | columnSettings | format | Per column, by name: {label, displayFormat, emptyText, booleanLabels, linkType, options, hidden...} - over what its presentation says (a total doesn't apply). | |
| On click | click | events | What a click on a mark does: {action: "FILTER", variable, value} sets a variable of this dashboard; {action: "DATAVIEW", dataview, filter} opens a DataView filtered (the where grammar); {action: "DASHBOARD", dashboard, variables, tab}; {action: "RECORD", dataview, pk}; {action: "URL", url, newTab, inEmbeds}. Values are formulas over (_ columns too) and ; targets by id. hint: the tooltip's last line. On a detail, the card. |
SELECT 'Ana Pérez' AS name, date '2026-10-01' AS last_visit, 12 AS visits, 'GOLD' AS level
Pivot table
The query returns the detail rows; PostgreSQL aggregates them into rows × columns, with subtotals and totals. Nothing is added up on screen, and an average is the real one, never an average of averages.
| Role | Takes | Unset |
|---|---|---|
| Rows | one or more levels down the side, outermost first | the first column that isn't a number |
| Columns | by hand: levels across the top, at most 60 distinct values | none |
| Values | what is aggregated | every number column |
Billing by customer, a column per month:
SELECT c.name AS customer,
       to_char(i.issued_on, 'YYYY-MM') AS month,
       ii.quantity * ii.unit_price AS billed
FROM invoices i
JOIN invoice_items ii ON ii.invoice = i.id
JOIN customers c ON c.id = i.customer
WHERE i.status <> 'DRAFT'
  AND i.issued_on >= date_trunc('year', current_date)
Rows takes customer on its own. Set Columns to month, and the aggregate of billed to Sum.
| Setting | |
|---|---|
| Aggregates | required for each value: Sum, Average, Minimum, Maximum or Count |
| Subtotals | a subtotal for each level of the rows. On by default |
| Row totals | a total column at the right. On by default |
| Column totals | a total row at the bottom. On by default |
| Sort rows by | a value's total, ascending or descending, computed by PostgreSQL before the row cap; unset, by the rows' own values |
| Value settings | per value or row column: its title, format, text when empty |
| On click | a click on a detail cell, with its dimensions in {{row.<column>}}. A total isn't clickable |
Totals come first in the result, so the row cap never cuts them. More than 60 distinct values across the Columns is refused, with the count: group them in the query.
PIVOT
The query's detail rows aggregated by PostgreSQL into rows × columns, with subtotals and totals - never added up on screen.
Size: 12 × 5 of the 12-column grid, at least 4 × 3 · Also: events, export
| Data | Code | Takes | Required | Unset | |
|---|---|---|---|---|---|
| Rows | rows | category, time | yes | first | One or more levels down the side, outermost first. Defaults to the first column that isn't a number. |
| Columns | columns | none | Levels across the top (at most 60 values). Optional. | ||
| Values | values | number | yes | all | What is aggregated - each with its aggregate (aggregates). Defaults to every number column. |
| Property | Code | Section | Values | |
|---|---|---|---|---|
| Aggregates | aggregates | format | Required for each value: {"total": "sum", "ticket": "avg"} - sum, avg, min, max or count, computed by PostgreSQL over the detail rows (an average is the real one, never an average of averages). | |
| Subtotals | subtotals | appearance | default true | A subtotal for each level of the rows. |
| Row totals | rowTotals | appearance | default true | A total column at the right. |
| Column totals | columnTotals | appearance | default true | A total row at the bottom. |
| Sort rows by | sortBy | appearance | {value: "total", direction: "DESC"} - rows ordered by a value's total. Unset: by the rows' own values. | |
| Value settings | columnSettings | format | Per value or row column, by name: {label, displayFormat, emptyText...} - over what its presentation says. | |
| On click | click | events | What a click on a mark does: {action: "FILTER", variable, value} sets a variable of this dashboard; {action: "DATAVIEW", dataview, filter} opens a DataView filtered (the where grammar); {action: "DASHBOARD", dashboard, variables, tab}; {action: "RECORD", dataview, pk}; {action: "URL", url, newTab, inEmbeds}. Values are formulas over (_ columns too) and ; targets by id. hint: the tooltip's last line. On a pivot, a detail cell - its rows' and columns' values; a total isn't clickable. |
SELECT * FROM (VALUES ('North', 'Jan', 120.5), ('North', 'Feb', 99), ('South', 'Jan', 80), ('South', 'Feb', 140.25), ('North', 'Jan', 30)) AS t(branch, month, total)
Next steps
- Visualization and Insertion: headings, text and frames.
- Dashboards in the App: downloading a table as CSV or Excel.