

Overview
In the admin: Dashboards
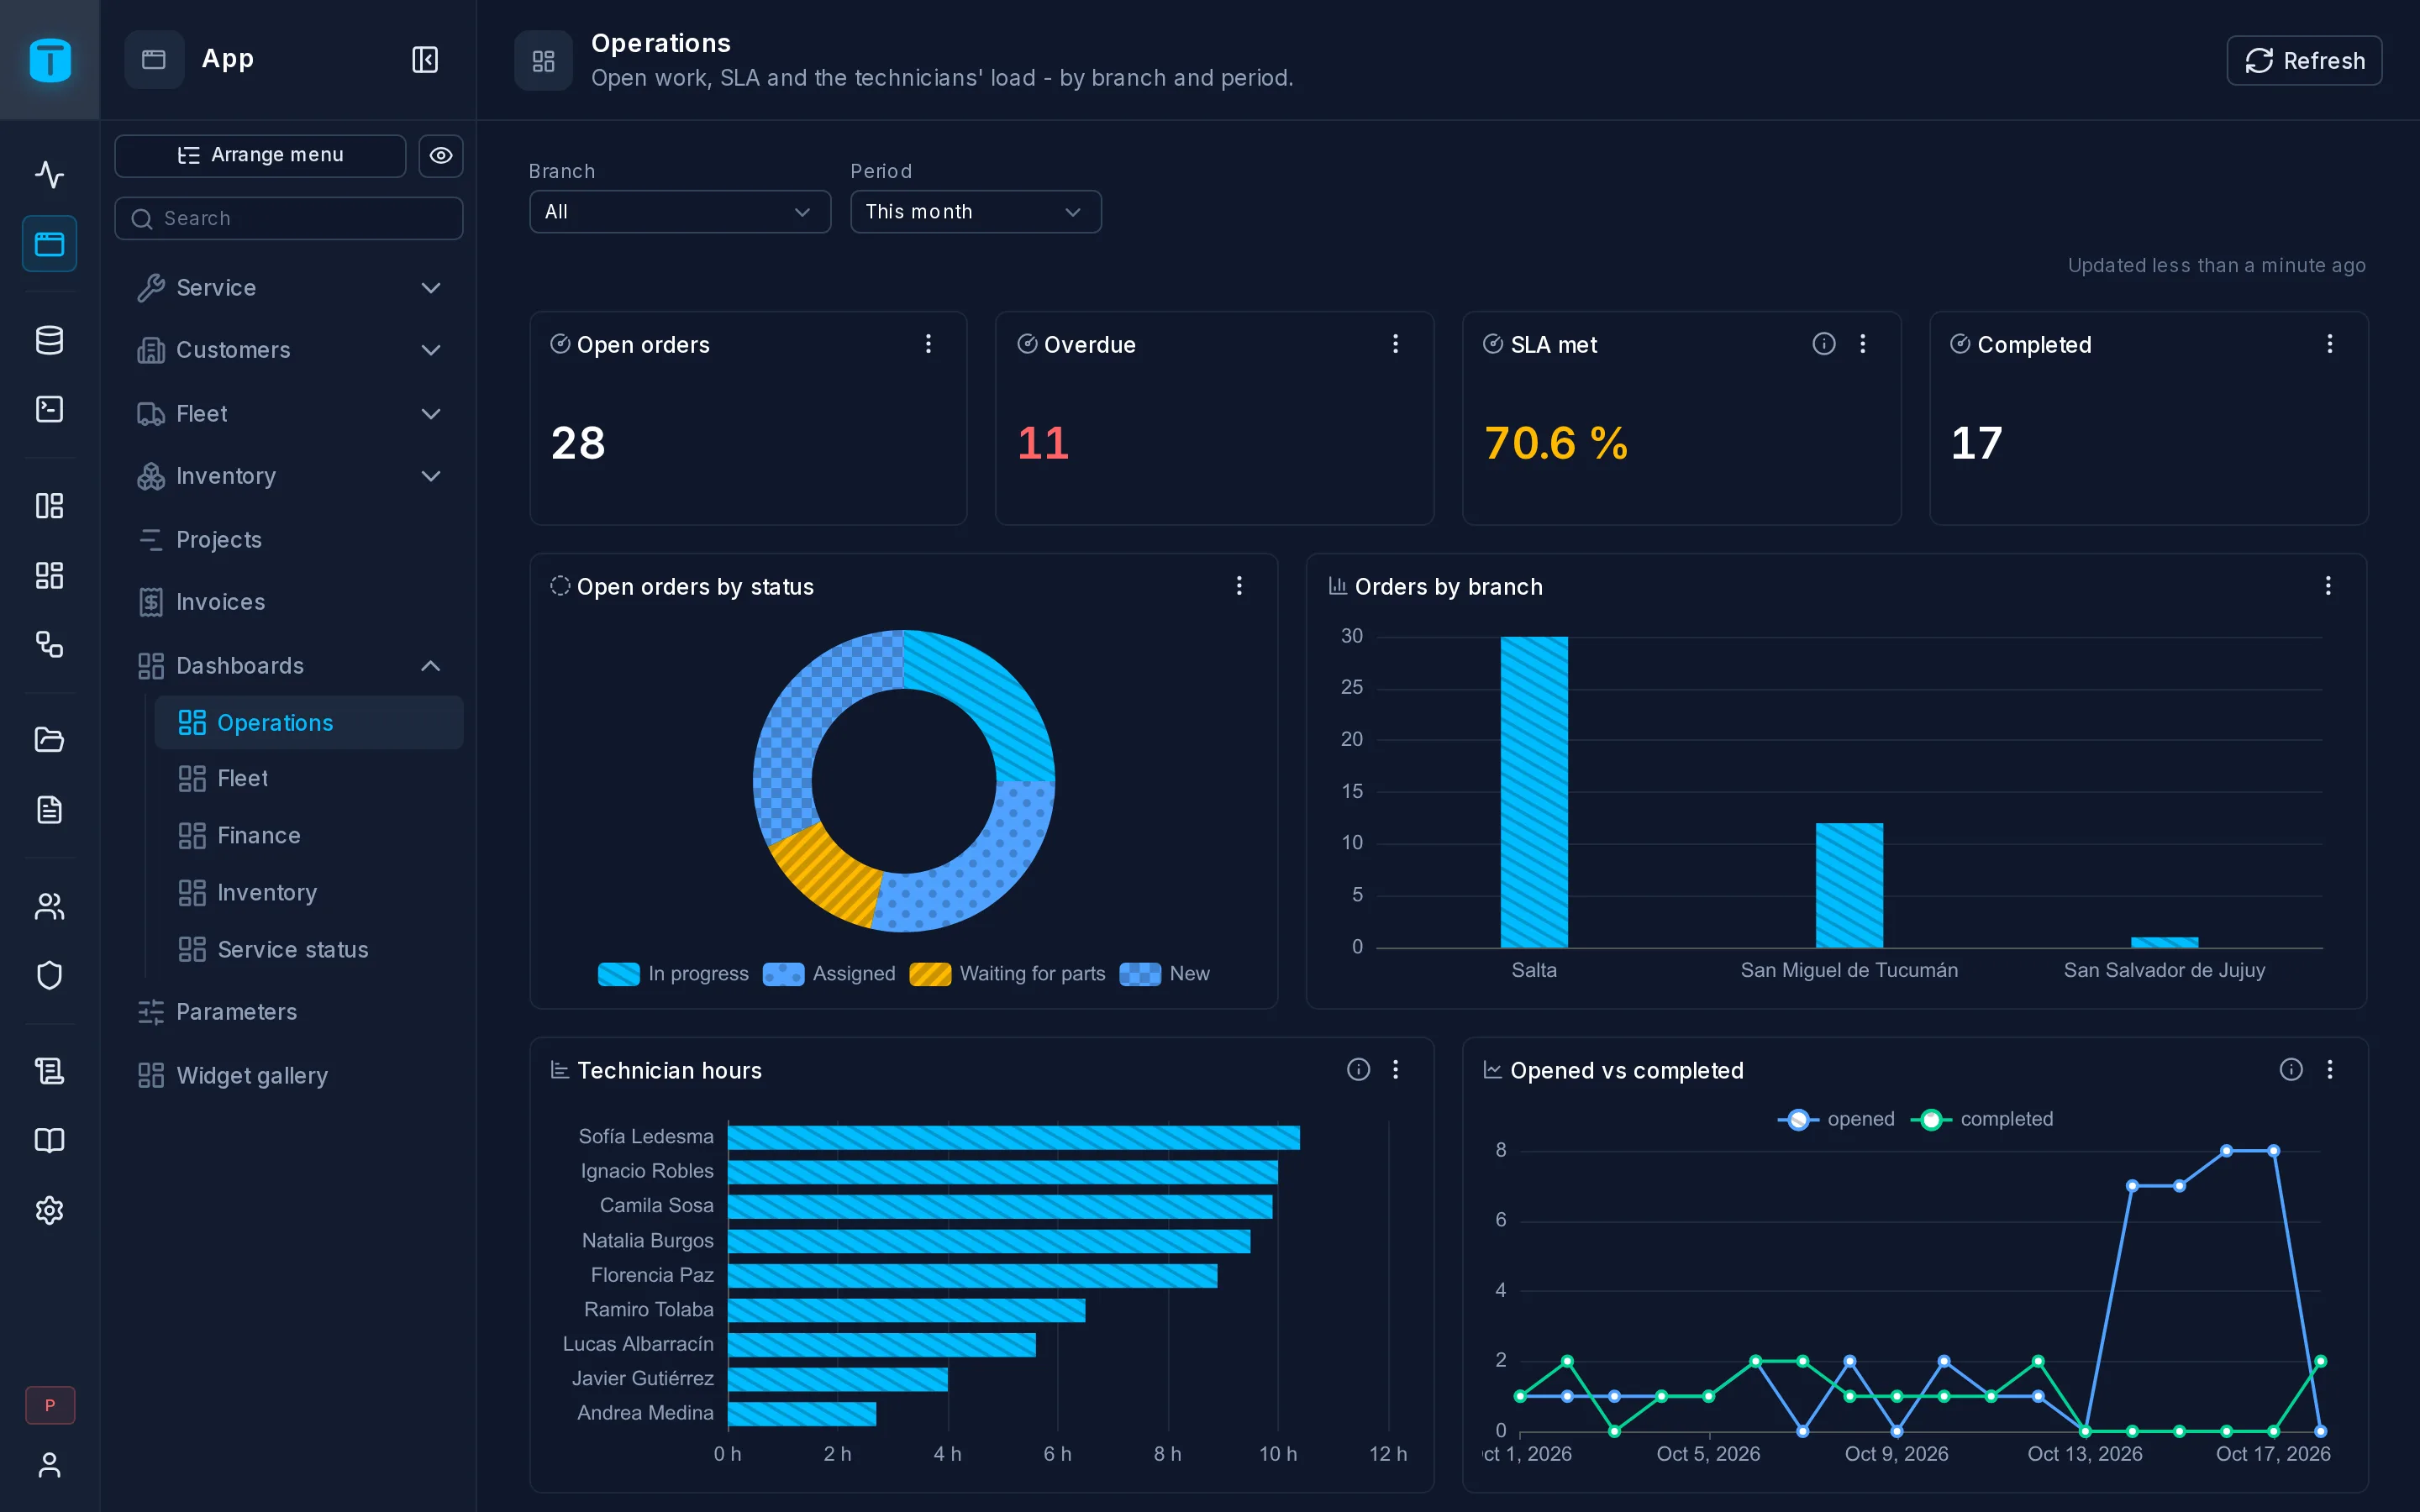
A dashboard is a report: a canvas of widgets, each drawing the result of one SQL query an administrator writes. Acme's Operations dashboard shows open work orders by status, the overdue ones in a table and the orders of each branch; its Finance dashboard shows revenue by month and the top customers. Viewers open the published version in the App and only read it. Nothing is ever written through a dashboard.
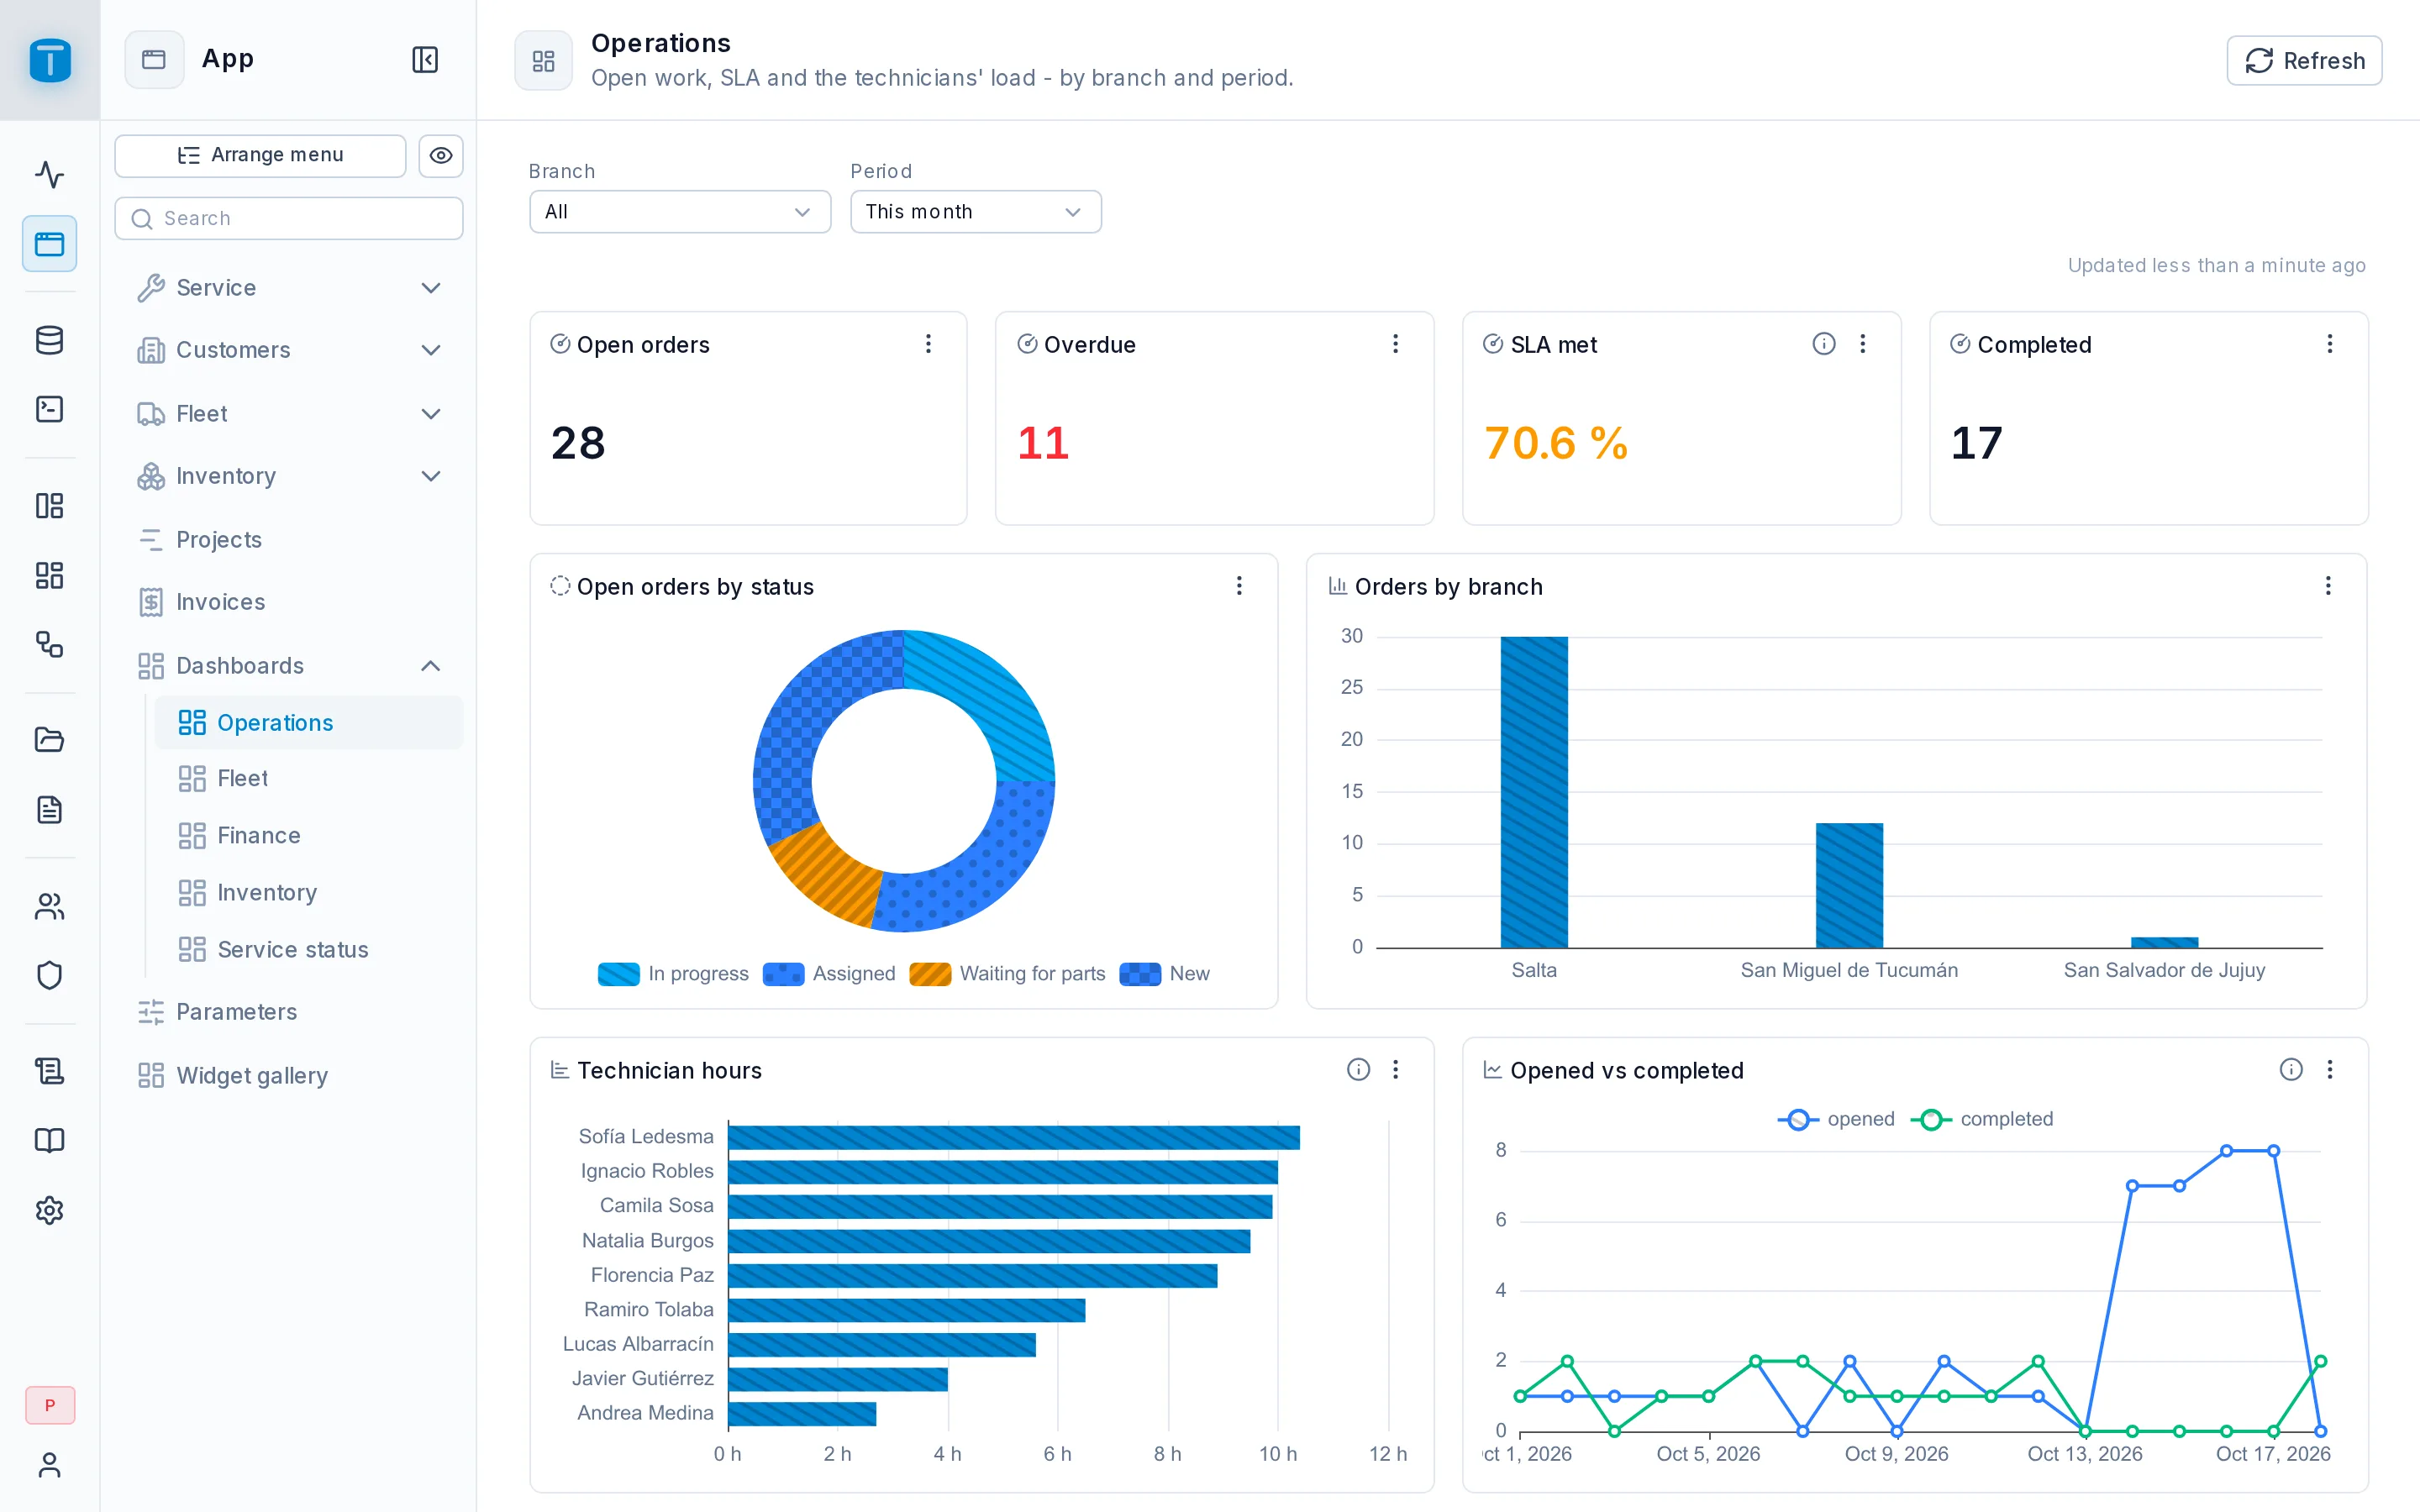
SQL first
Each widget's data is a SELECT you write, in the style of Metabase or Grafana. SQL can join tables, bucket dates with date_trunc, compute columns and return several series at once, which the Data API's filters can't. What the widget draws follows from what the query returns: a KPI takes the first number column, a bar chart a category and its number columns. You adjust the rest in the widget's properties, and data-dependent presentation, such as a row's color, comes from the query itself through SQL conventions.
SELECT status, count(*) AS orders
FROM work_orders
WHERE status NOT IN ('COMPLETED', 'CANCELLED')
GROUP BY status
How a query runs
- Administrators only write it. Building and editing dashboards is administration. A viewer never sends SQL: the App runs a published widget by its id, and the server reads the query from the published version.
- PostgreSQL makes it read-only. Every query runs in its own
READ ONLYtransaction that is always rolled back, with a time limit and a row cap. A write of any kind, even inside a function the query calls, is refused by PostgreSQL. See Editing a widget. - It runs with the dashboard's authority, not the viewer's permissions. Row filters and field permissions don't apply to dashboard queries. The administrator who publishes a dashboard decides what it shows, and every role granted it sees what its queries return.
$USER.Variables: $VAR filters, $USER restricts
A query can read two kinds of values, always bound as parameters, never pasted into the SQL:
| Reference | Set by | Use it to |
|---|---|---|
$VAR.<name> | the viewer, in the variables bar above the widgets | filter: a period, a branch, a warehouse |
$USER.<column> | the server, from the viewer's own user row, on each run | restrict: WHERE branch = $USER.branch |
A viewer can send any value of the right type for a $VAR, whatever the bar offers, so a $VAR never protects data. $USER comes from the user's current row in users, including columns you added, such as Acme's branch. See Variables.
From draft to the App
- Create it, blank or proposed from a table: Creating a Dashboard.
- Build it in the editor: add widgets, write their queries, arrange them. Every change is saved to the draft as you make it.
- Publish it. Viewers only ever see a published version.
- Grant it to the roles that read it, in Settings › Security. It appears in their App menu, the same menu as the DataViews. See The App and Drafts and publishing.
A dashboard can also be shown inside a DataView page, and outside TotalBase to people without an account, through a public link or a signed embed. See In the App and Settings › Share.
In the admin
Dashboards in the rail lists every dashboard by name, with a search box and New Dashboard. Clicking one opens its editor. Each entry shows its icon and color and these marks:
| Mark | Means |
|---|---|
| Live | published, and the draft equals the live version |
| Changes | published, with unpublished changes in the draft |
| Draft | never published: no viewer sees it yet |
| warning triangle | a widget's query names a column, table or function that's gone (renamed or dropped outside TotalBase); the tooltip names the widgets |
| crossed-out eye | not in the App menu; it still opens embedded in a DataView page, and by its link for whoever is granted it |
The warning comes from PostgreSQL: each widget's query is planned without reading a row, and a refusal for a missing column, table or function marks it.
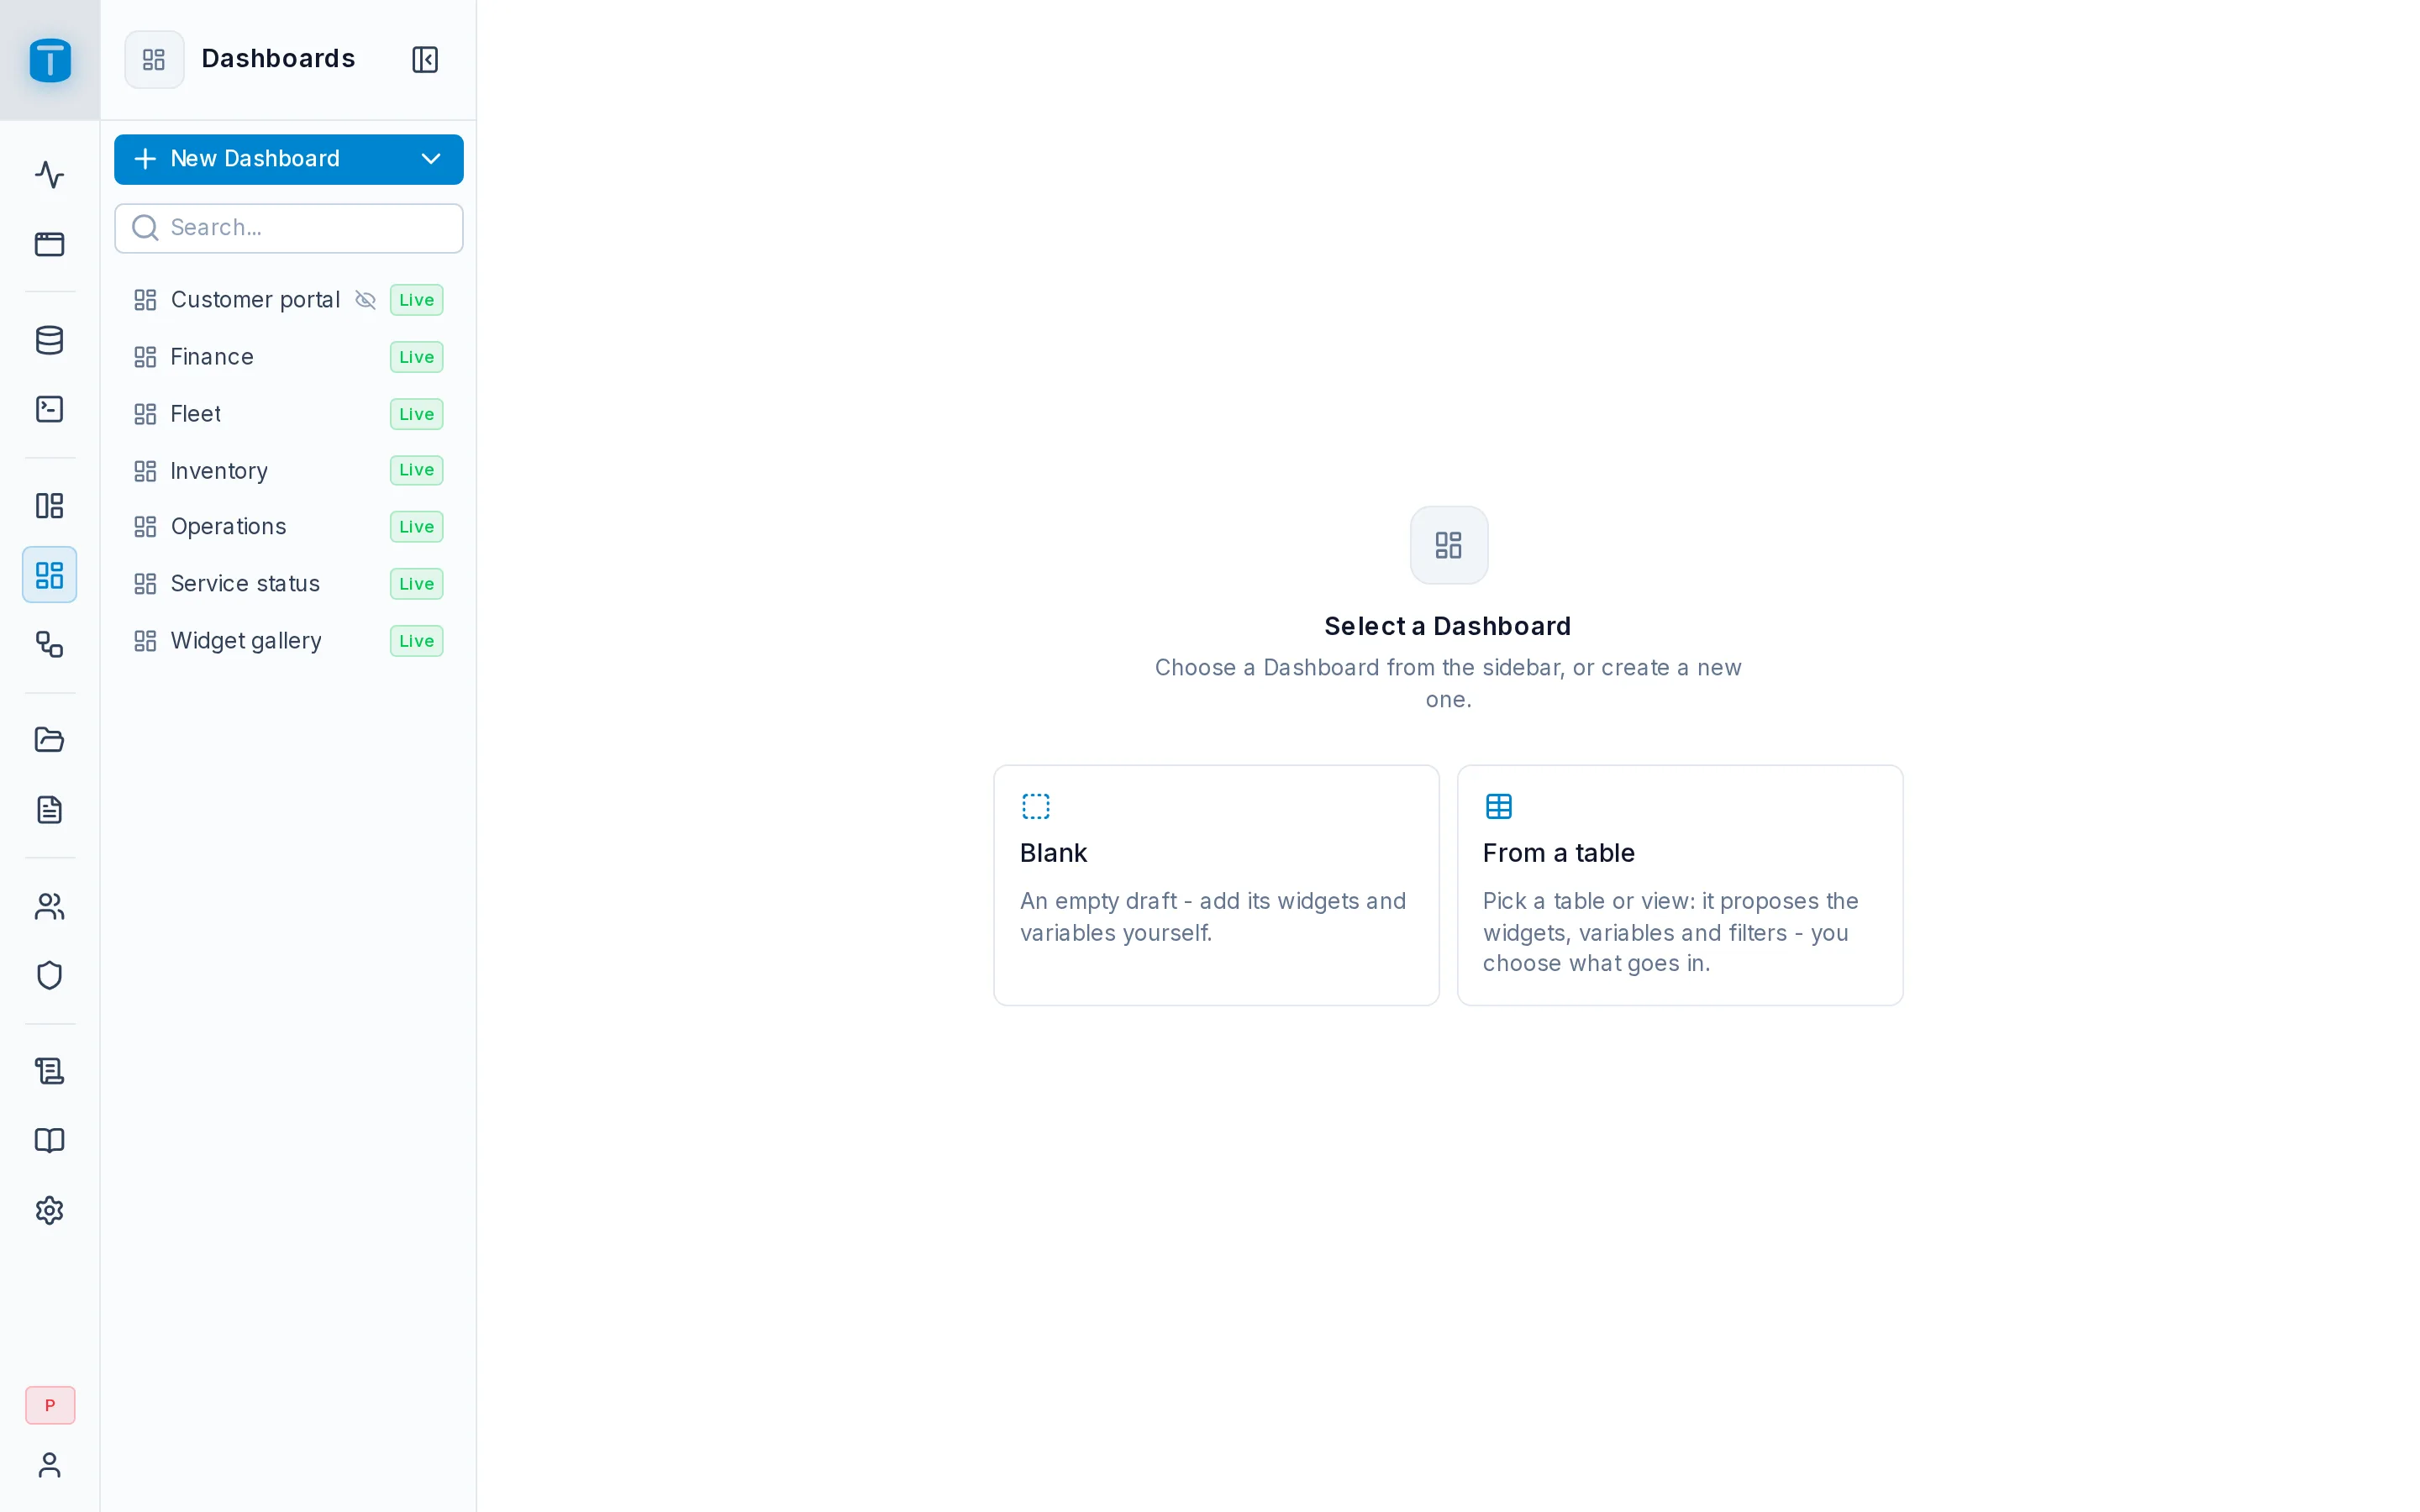
Building dashboards is for administrators. Agents build them the same way through the MCP server, with tools such as suggest_dashboard, apply_dashboard, save_widget and publish_dashboard.
Next steps
- Creating a Dashboard: blank, or from a table.
- Editor: the canvas.
- Object access: why a dashboard is a report, not a DataView.