

Maps
In the admin: a Dashboard › a widget › Edit
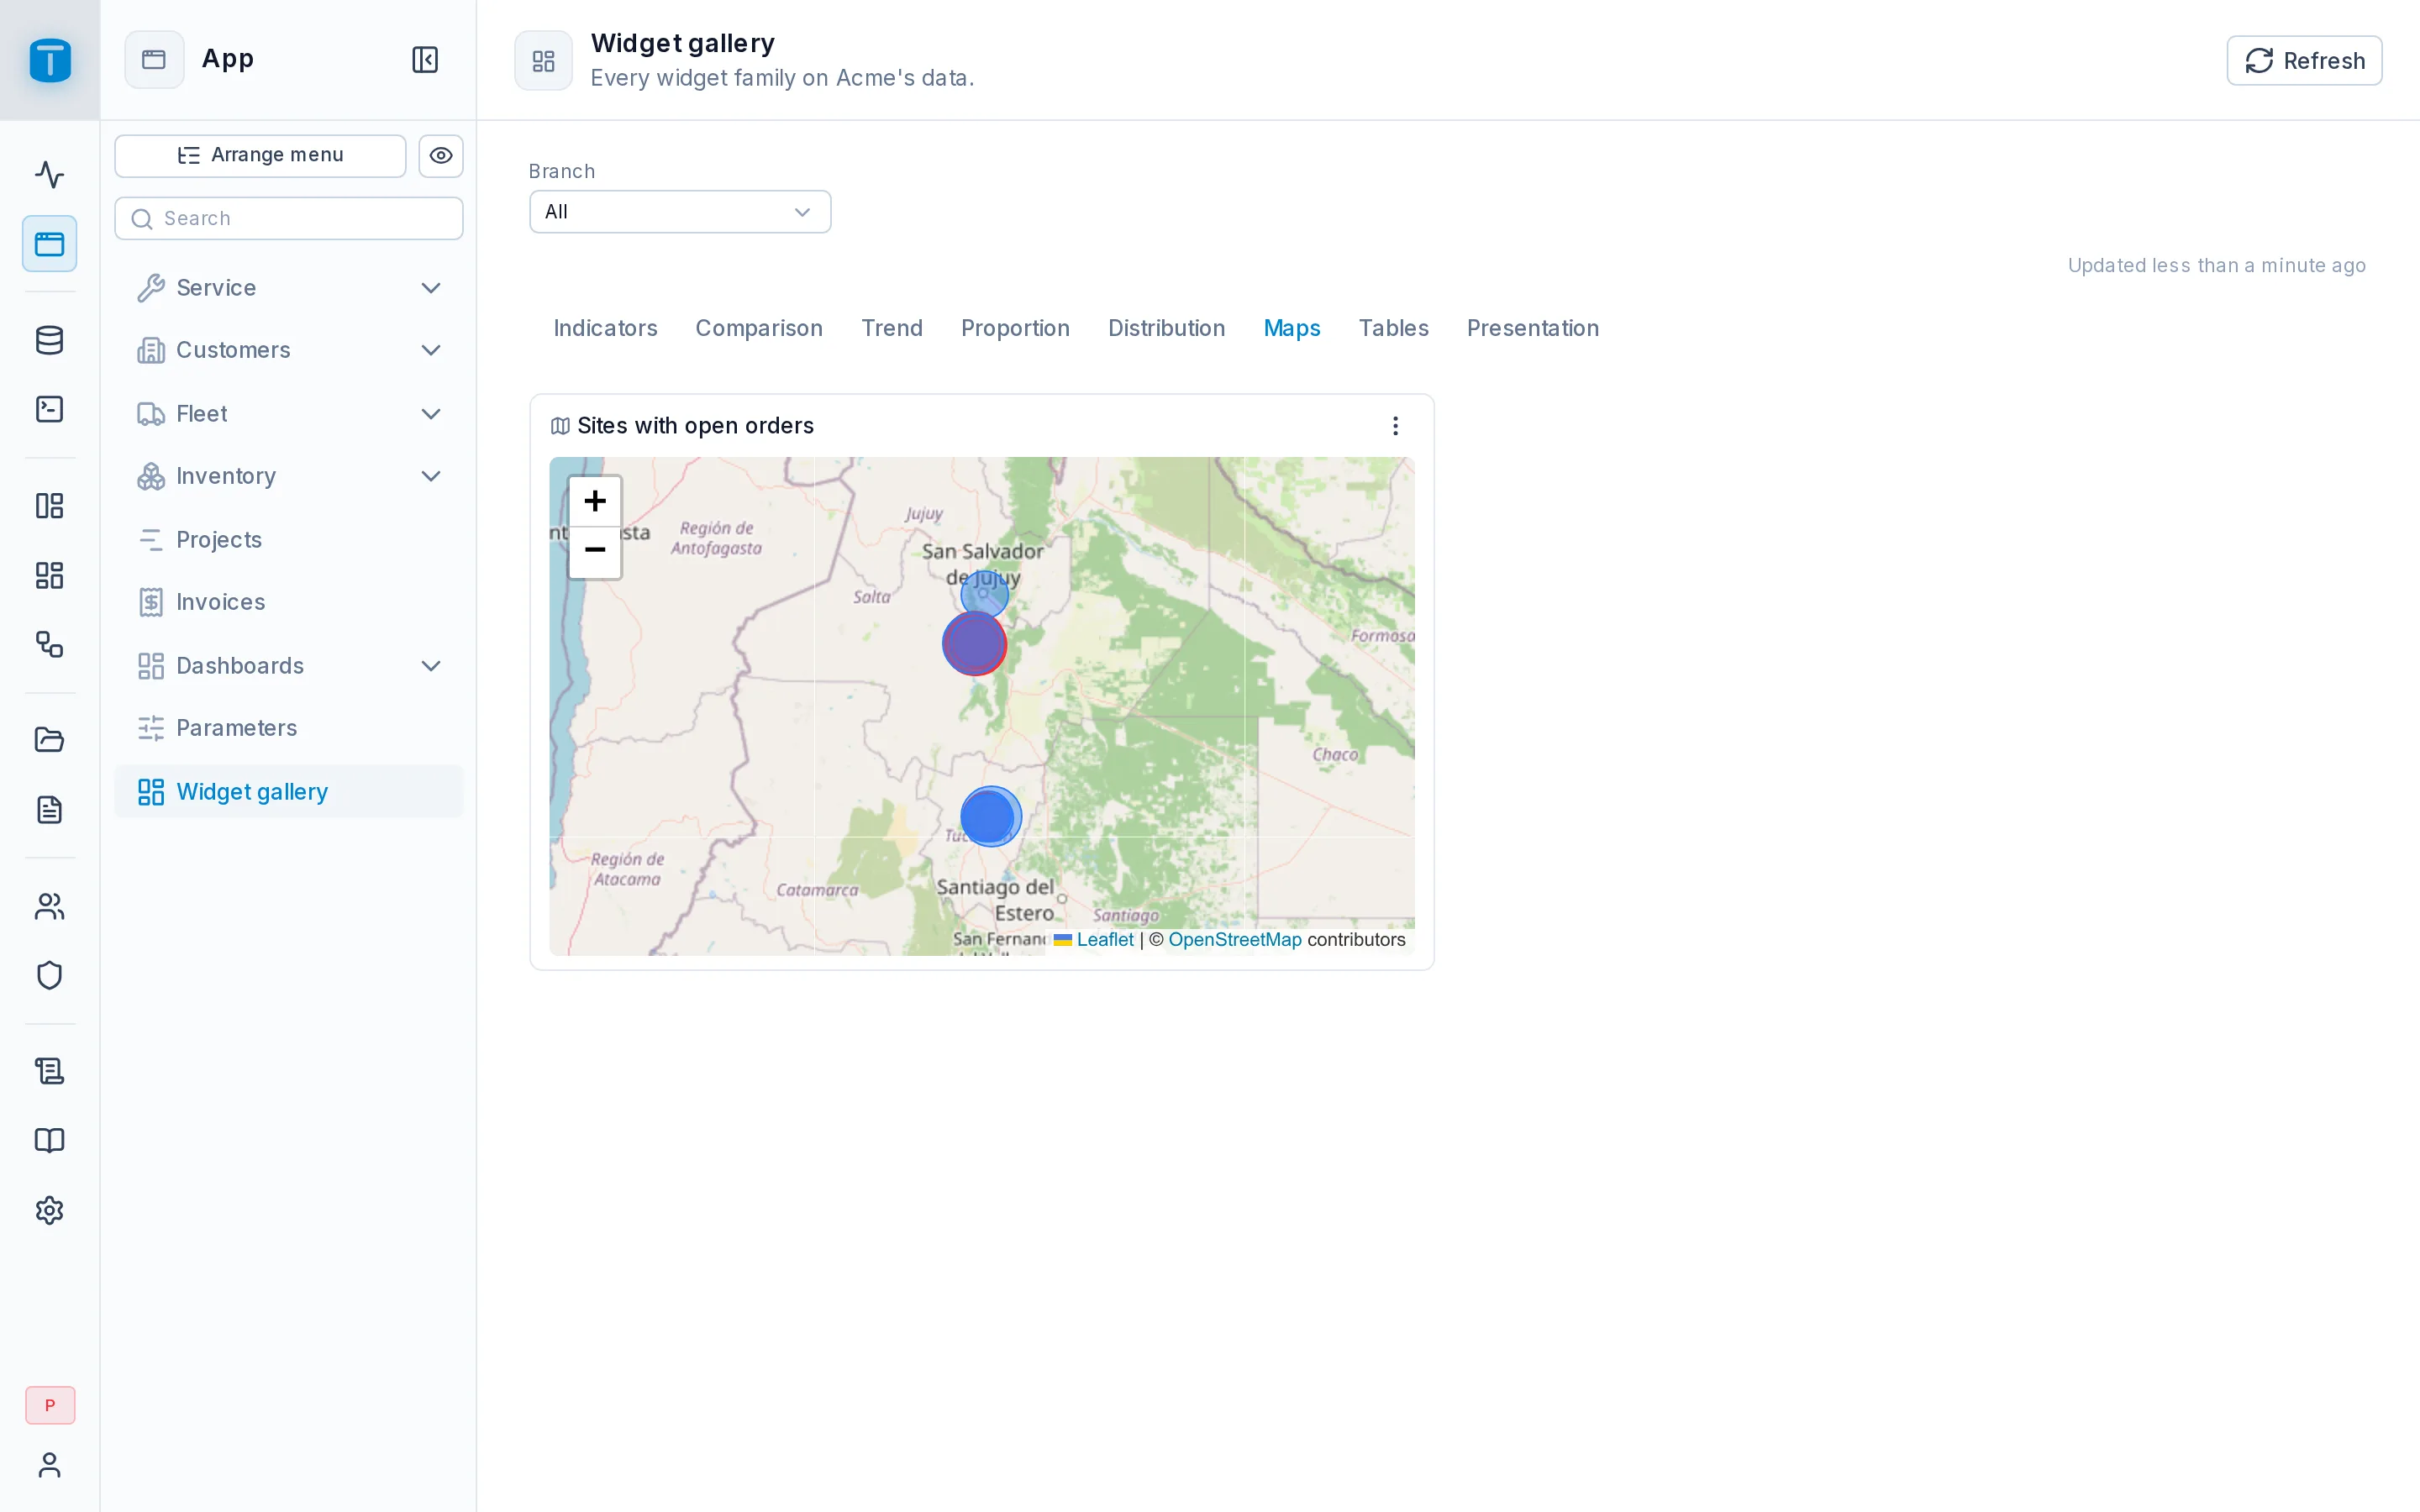
The Map draws the query's rows as points on a street map: Acme's sites with open orders, the fleet's latest positions. It uses the instance's map tiles, the same as a DataView's map. See Settings › Maps.
What it takes
| Role | Takes | Unset |
|---|---|---|
| Location | a point column: x is the longitude, y the latitude | the first point column |
| Latitude, Longitude | two number columns, chosen by hand, when there's no point column | none |
| Label | shown in a point's tooltip | the first column that isn't a number |
| Size | scales each circle: its area grows with the value | none |
A position always comes from a column's type, never its name. Rows with no position, or with coordinates out of range, are skipped. When none is left, the card says so. point(lng, lat) builds a point from two numbers.
Example
Acme's sites with open work orders, sized by how many, red when one is overdue:
SELECT s.name AS site, s.location,
       count(wo.id) AS open_orders,
       CASE WHEN bool_or(wo.due_at < now()) THEN 'red' ELSE 'emerald' END AS _color
FROM sites s
JOIN work_orders wo ON wo.site = s.id
WHERE wo.status NOT IN ('COMPLETED', 'CANCELLED')
  AND ($VAR.branch IS NULL OR s.branch = $VAR.branch::uuid)
GROUP BY s.id
Choose open_orders for Size. The _color column colors each point with a palette name and is never shown. GROUP BY s.id lets the query return the site's other columns: PostgreSQL knows they depend on its key, and a point can't be grouped by itself.
Settings
| Setting | |
|---|---|
| Group nearby points | joins points close together into a numbered circle |
| Format | how the Size value reads in a point's tooltip; unset, its column's format |
| Color | the points' color; unset, the theme's primary |
| Color column | a column whose palette name colors each point; unset, _color |
| On click | what a click on a point does: open the site's record, filter the dashboard by it |
Tooltips are plain text: a value from the query is never read as HTML.
vehicles_latest_positions view, and set the dashboard's auto-refresh so the map follows the vehicles while it's open.Reference
MAP
Points on a street map - from a point column, or latitude and longitude.
Size: 6 × 5 of the 12-column grid, at least 3 × 3 · Also: events, export
| Data | Code | Takes | Required | Unset | |
|---|---|---|---|---|---|
| Location | location | point | first | A point column (x = longitude, y = latitude). Defaults to the first point column. | |
| Latitude | latitude | none | Only without a point column - chosen by hand, with Longitude. | ||
| Longitude | longitude | none | Only without a point column - chosen by hand, with Latitude. | ||
| Label | label | category | first | Shown on a point's tooltip. Defaults to the first column that isn't a number. | |
| Size | size | number | none | Scales each point by this value. Optional. |
| Property | Code | Section | Values | |
|---|---|---|---|---|
| Group nearby points | cluster | appearance | default false | Joins points close together into a numbered circle. |
| Format | displayFormat | format | How the Size value reads in a point's tooltip - a displayFormat pattern. Unset: its column's. | |
| Color | color | appearance | A palette hue for its marks - unset, the theme's primary. | |
| Color column | colorColumn | appearance | A column whose value - a palette name: red, emerald, amber... - colors its row's mark. Unset, a column named _color, if the query returns one. | |
| On click | click | events | What a click on a mark does: {action: "FILTER", variable, value} sets a variable of this dashboard; {action: "DATAVIEW", dataview, filter} opens a DataView filtered (the where grammar); {action: "DASHBOARD", dashboard, variables, tab}; {action: "RECORD", dataview, pk}; {action: "URL", url, newTab, inEmbeds}. Values are formulas over (_ columns too) and ; targets by id. hint: the tooltip's last line. |
SELECT * FROM (VALUES ('Buenos Aires', point(-58.38, -34.60), 120), ('Córdoba', point(-64.18, -31.42), 80), ('Rosario', point(-60.65, -32.95), 60)) AS t(store, location, revenue)
Next steps
- Tables: rows, one record, and pivots.
- SQL Conventions: row colors.