

Gantt
In the admin: New DataView › Gantt · Settings › Views › Gantt
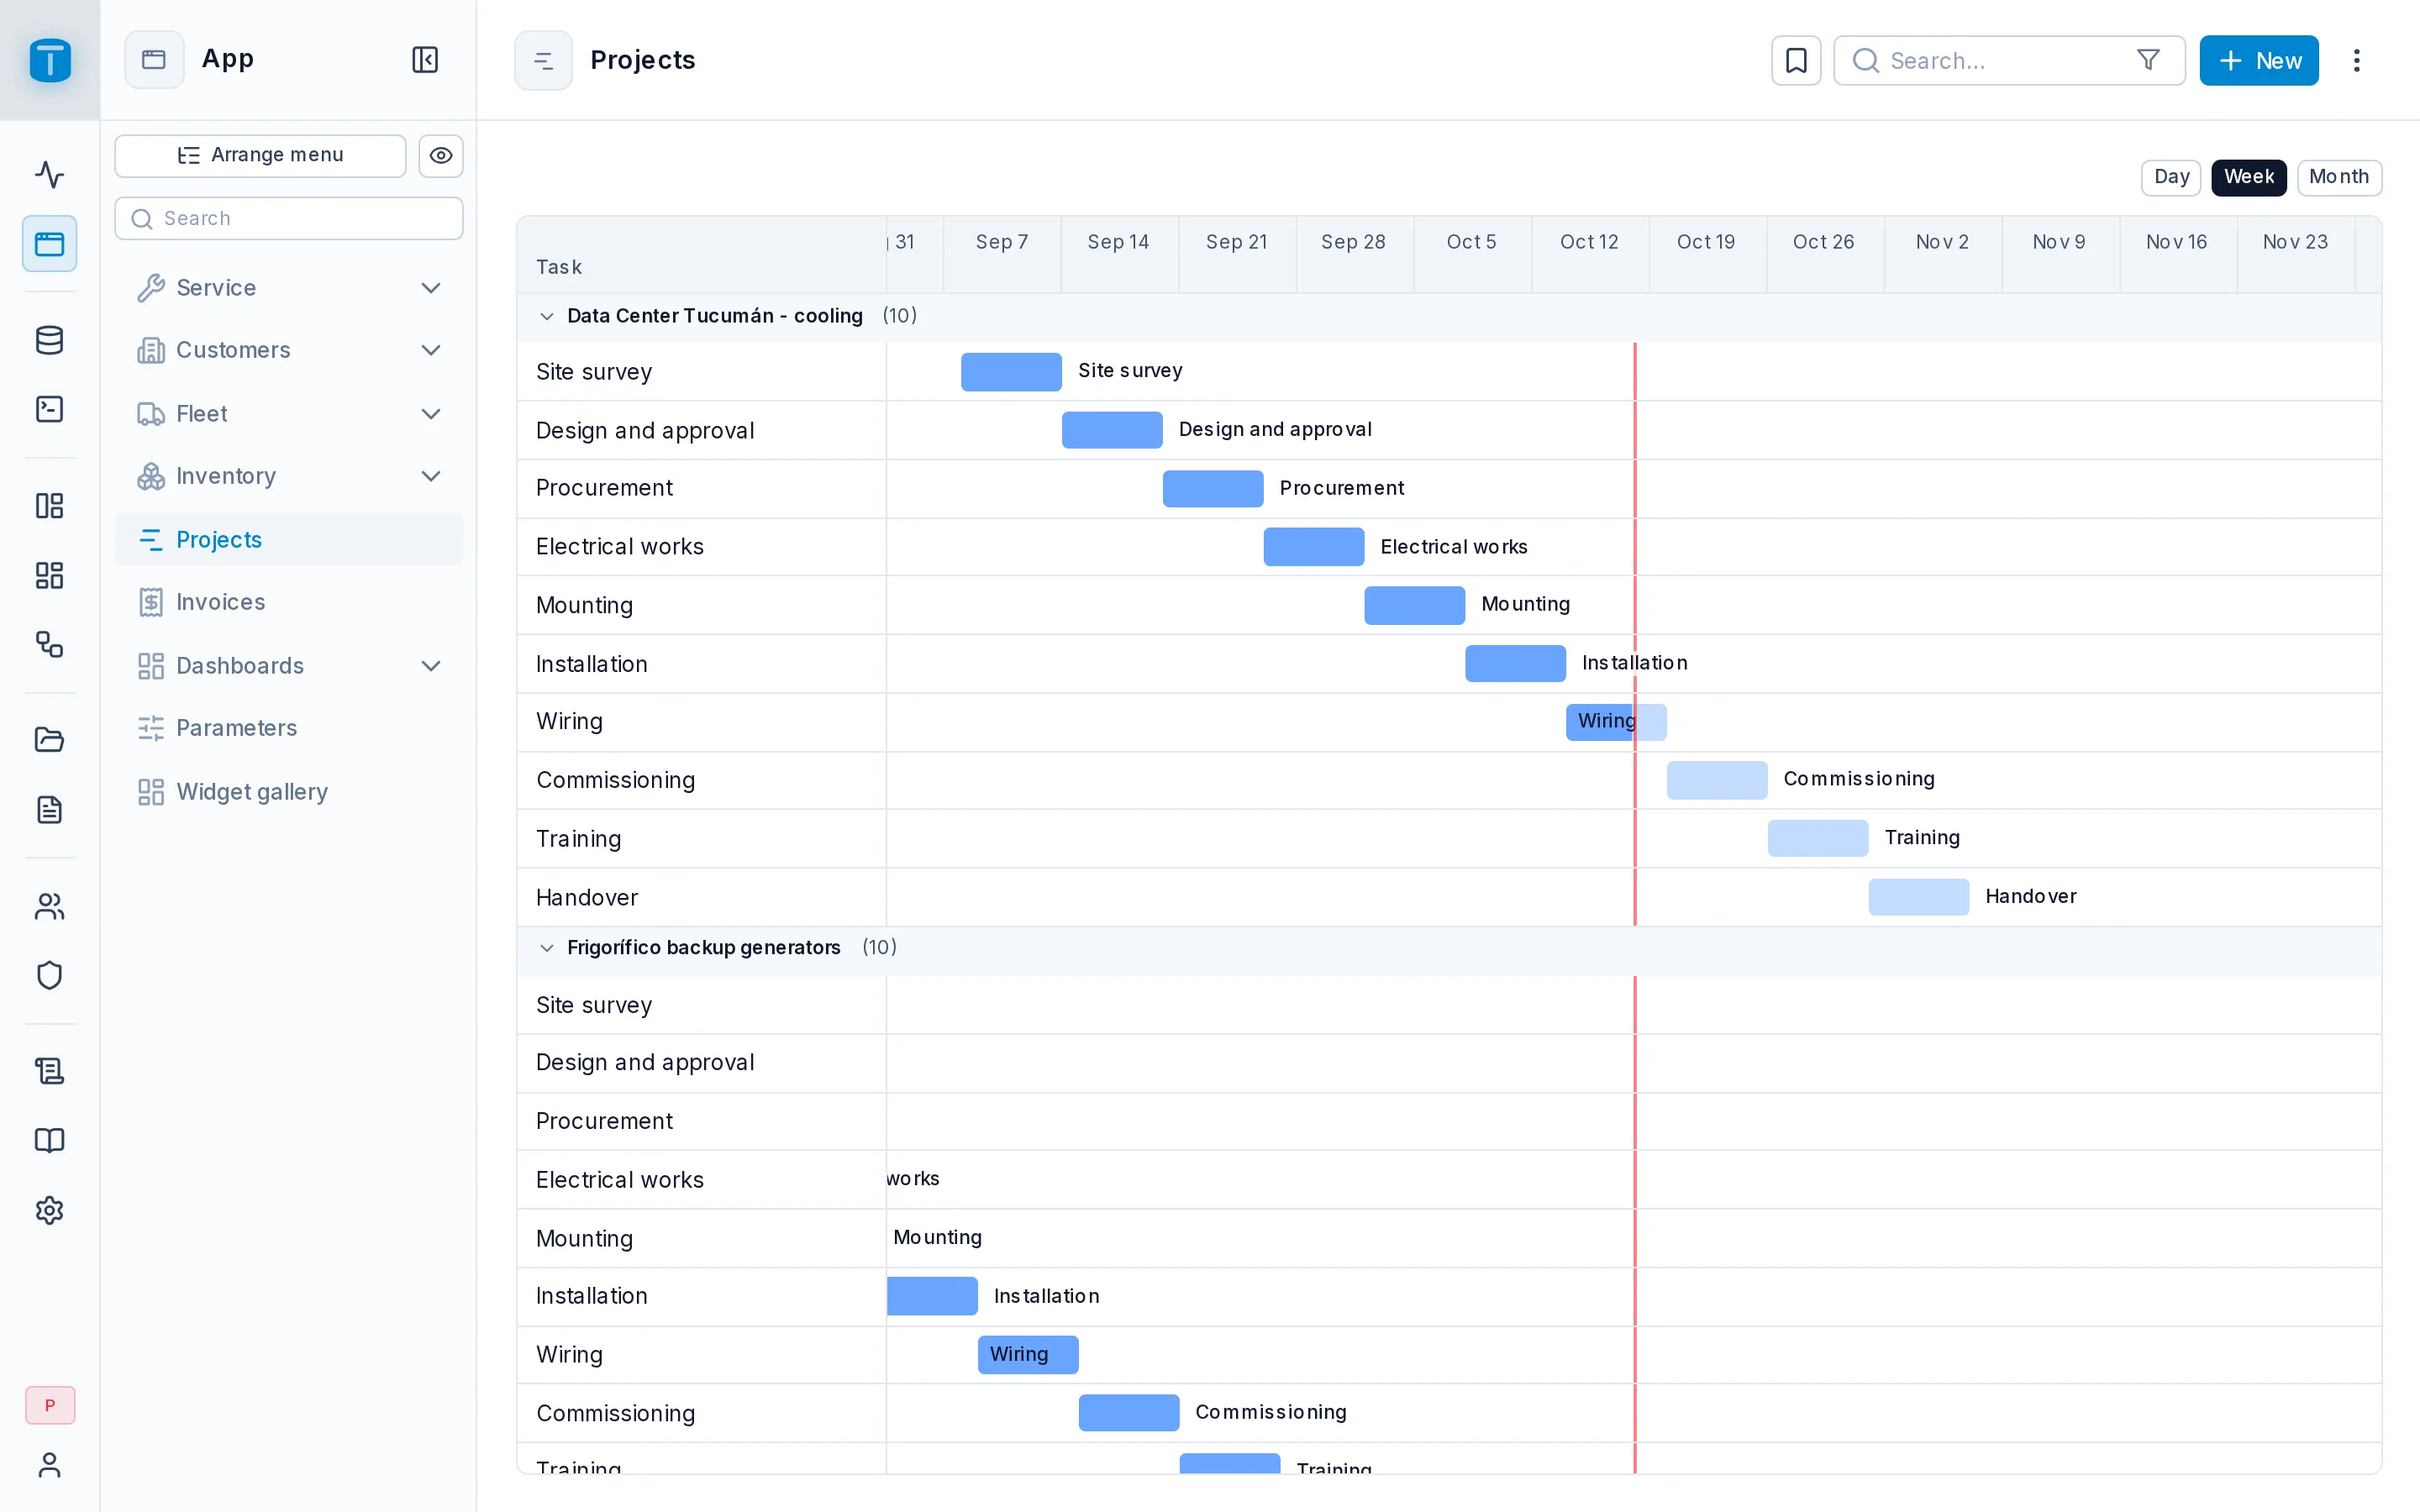
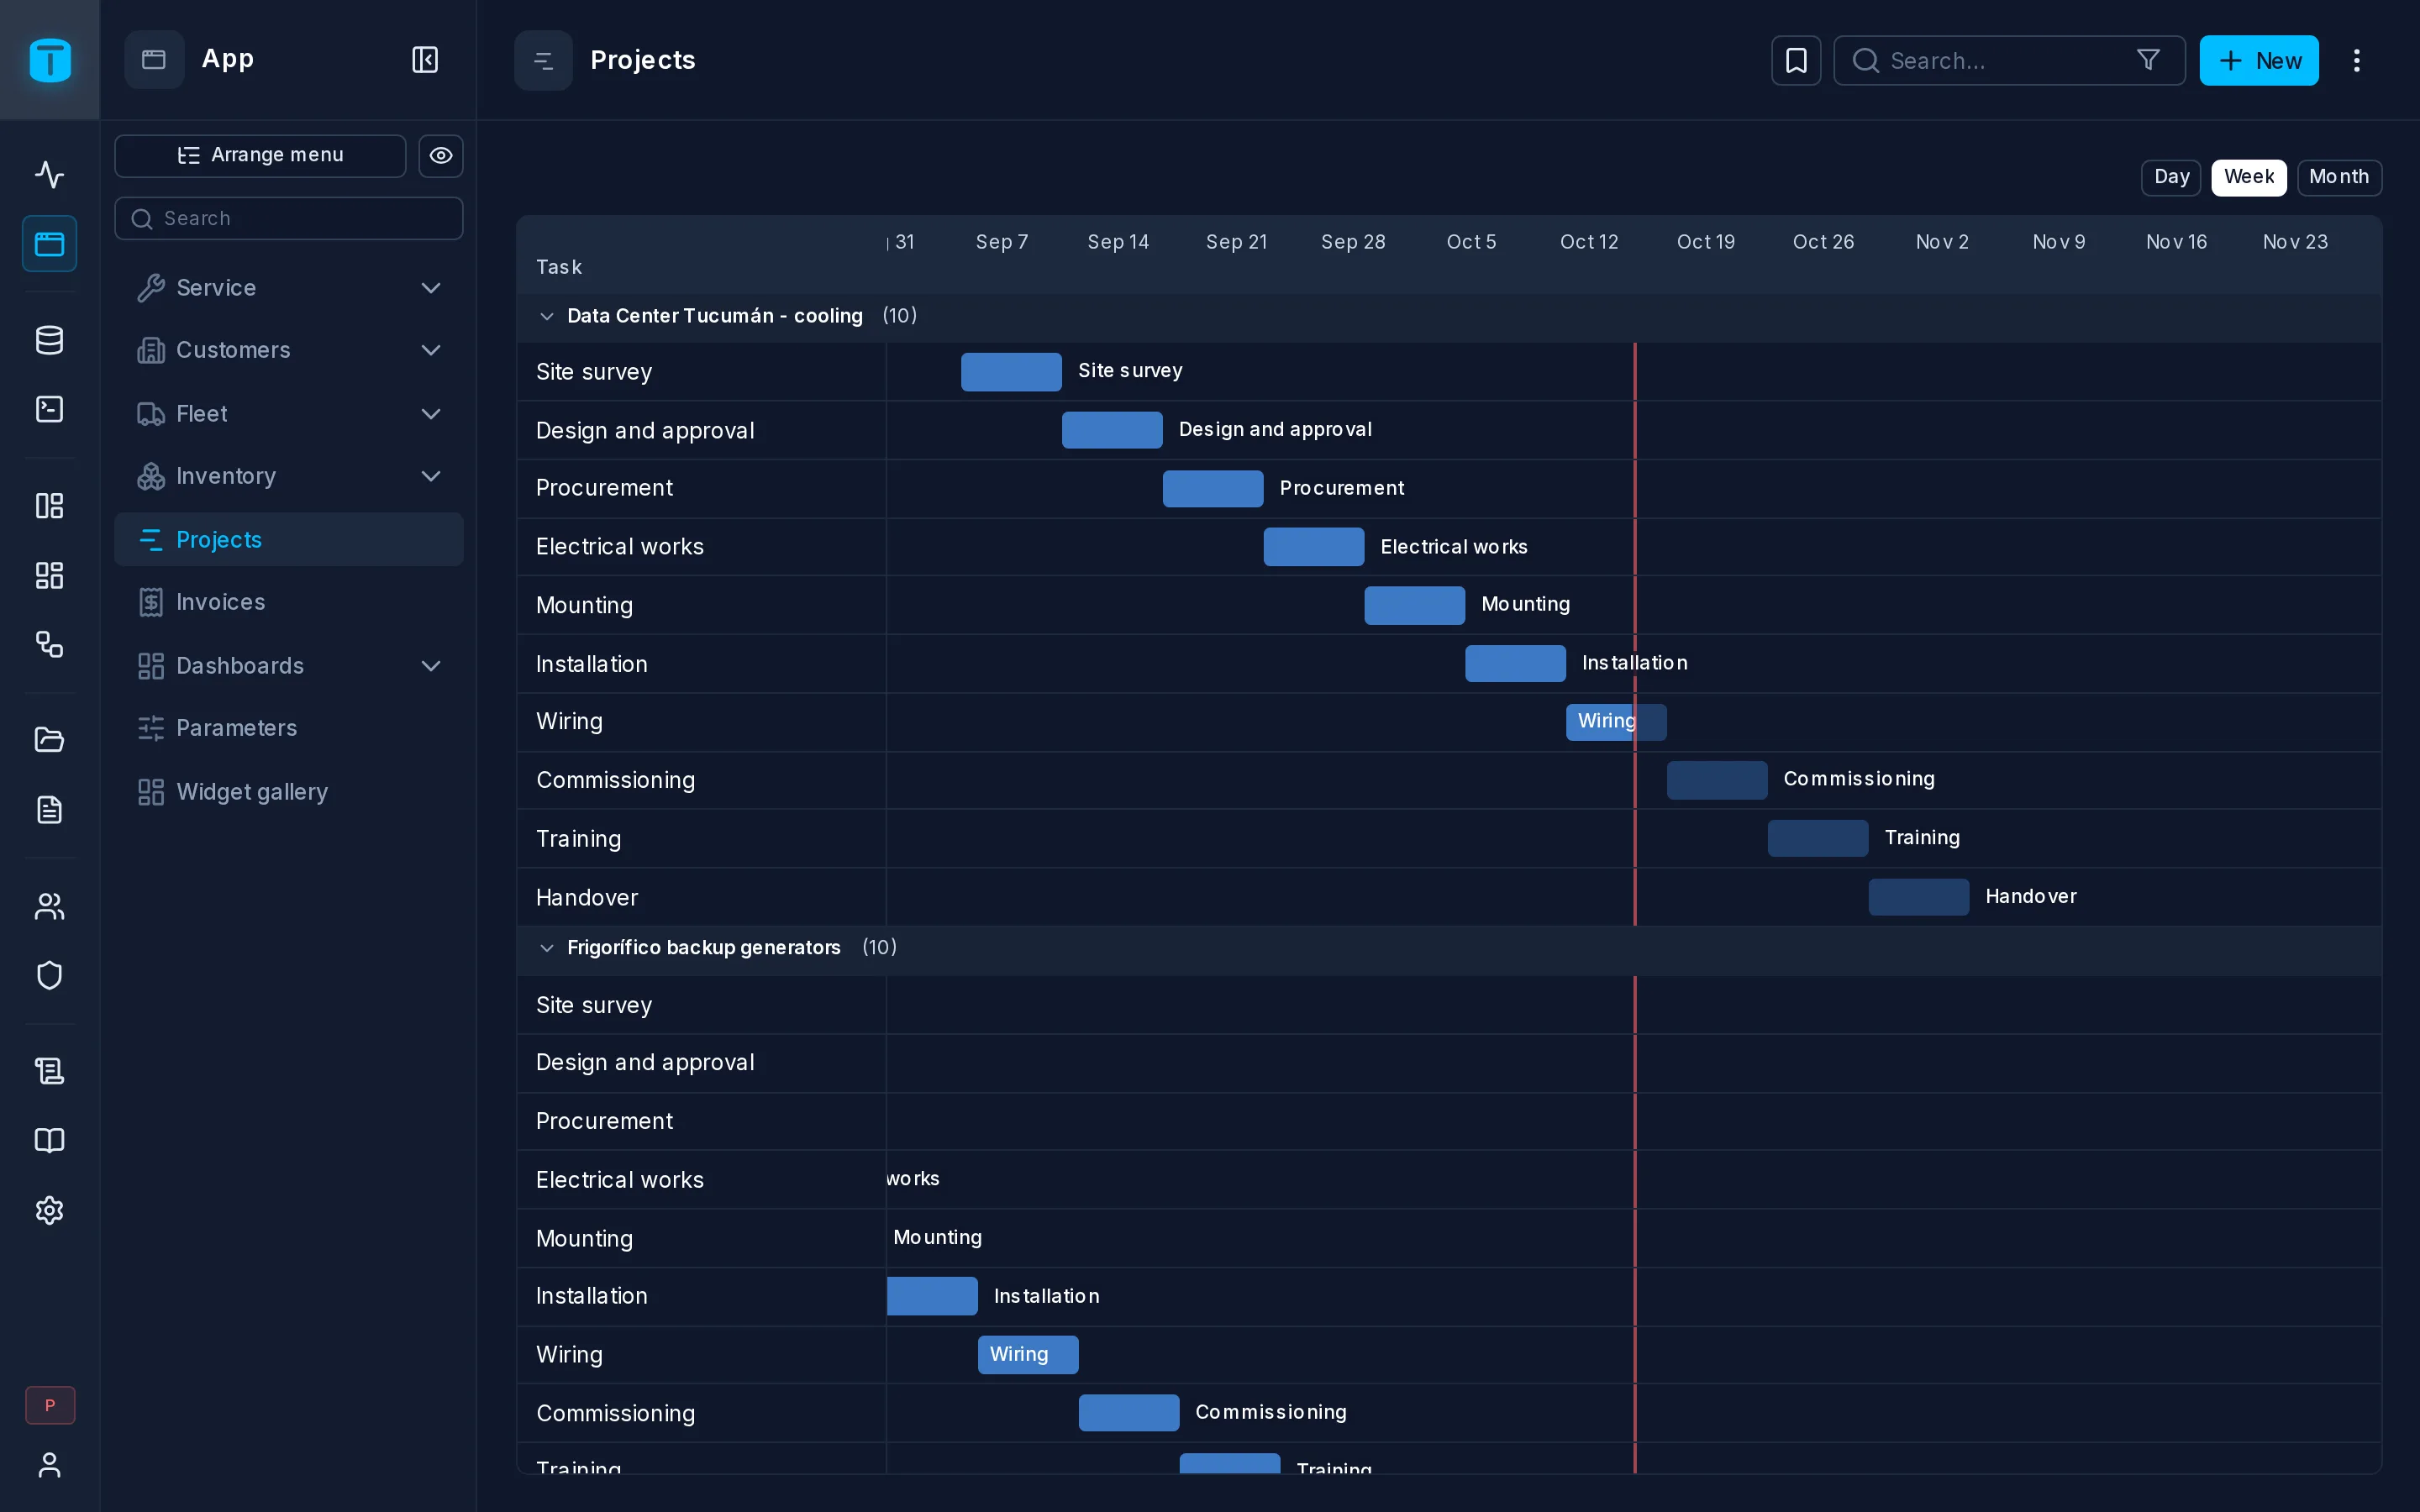
A Gantt draws each row as a bar from its start date to its end date, on a timeline. Use it for anything that takes time: project tasks, installations, rentals, leaves.
At Acme, Projects shows the tasks of each solar installation, one swimlane per project, each bar filled up to the task's progress.
What it needs
Two date or timestamp columns: a start and an end.
The layout
| Field | |
|---|---|
| Start date, End date | Required |
| Group by | Optional, a foreign key. Each row of the table it points at becomes a swimlane, as in a Kanban. Without it, one flat timeline |
| Bar title | Required. The bar's headline |
| Bar description | Optional, shown in the bar's tooltip |
| Progress | Optional, a number column from 0 to 100. The bar fills up to it |
| Color | Optional, a color per row |
| Default bar color | Used when there's no Color, or it's empty |
| Default zoom | Day (the default), Week or Month |
| Lane order | With Group by: move the swimlanes up or down |
The wizard proposes a Progress column named progress, percent_complete or completion, and the lane order and color from the referenced table, as Kanban does.
A color can be a palette name, a hex value or a theme color such as info or error.
What users can do
- Drag a bar to move it, or drag either end to change its start or end. The row is updated through the Data API, where the user may update it, and PostgreSQL decides: a
CHECK (ends_on >= starts_on)on the tasks refuses one that would end before it starts. - Zoom between days, weeks and months.
- Open a bar to see its record.
Bars are ordered by their start date.
Limits
Up to 500 bars (dataviews.gantt_max_bars, in Settings › Features › DataViews). The Gantt draws bars; it doesn't draw dependencies between them.
Next steps
- Calendar: rows on one date.